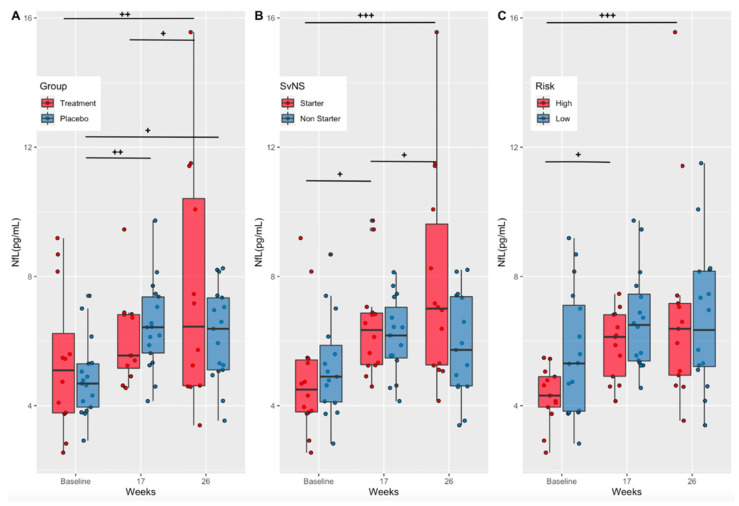
Figure 4.
Serum NfL concentrations by treatment group, starter status, and risk. (A) Serum NfL concentrations (pg/mL) in the treatment and placebo groups at baseline, mid-season (week 17), and at end of treatment (week 26). (B) Serum NfL concentrations (pg/mL) in starters and non-starters at baseline, mid-season (week 17), and at end of treatment (week 26). (C) Serum NfL concentrations (pg/mL) in high- and low-risk position groups at baseline, mid-season (week 17), and at end of treatment (week 26). NfL, neurofilament light; p-values show significance within groups from baseline values (+) according to repeated measures ANOVA and estimated marginal means; p-values + p < 0.05; ++ p < 0.01, +++ p < 0.001.

