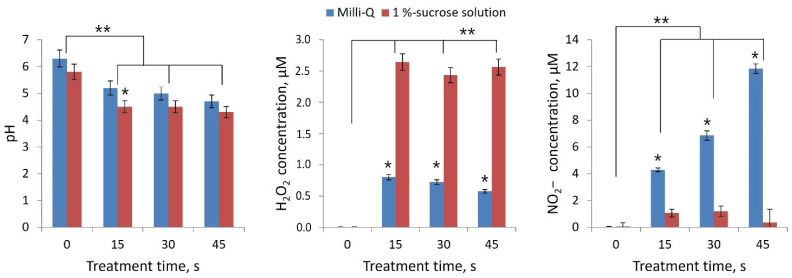
Figure 6.
Change in pH and generation of H2O2 and NO2− when DBD CAP was exposed to Milli-Q water and aqueous sucrose solution (1%) for 15, 30, and 45 s. Number of independent experiments was 5. * indicates a significant difference at 5% level in comparison with Milli-Q group with 1%-sucrose solution group at same treatment time (p < 0.05, Mann–Whitney U test). ** indicates a significant difference at 5% level in comparison with the control (treatment time 0 s) (p < 0.05, ANOVA). Data are presented as mean values and standard errors of the mean.

