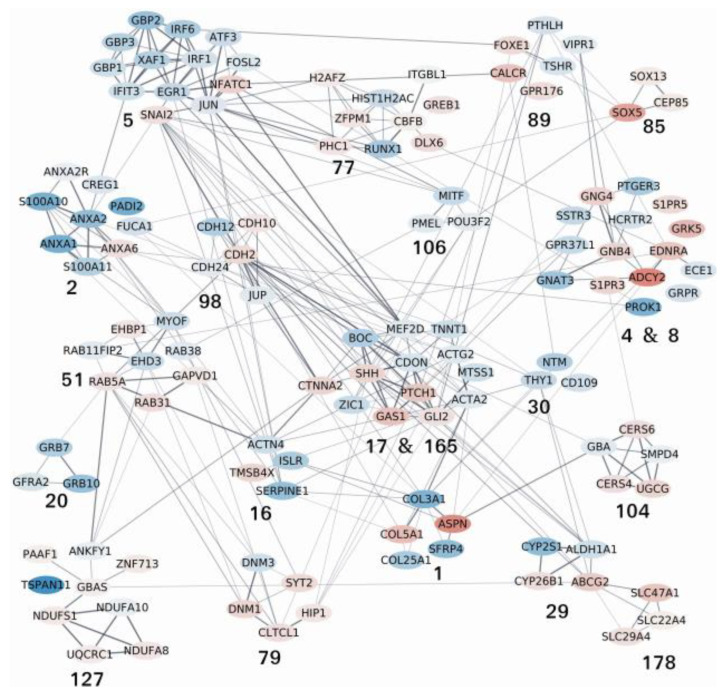
Figure 7.
Network of protein–protein interactions between the members of the active modules containing one or more of the identified genes of interest listed in Table 1. The nodes on the network correspond to genes. Node colors represent the log2 fold change values of the corresponding gene on a scale varying from blue (for the most underexpressed genes) to red (for the most overexpressed genes). Edges correspond to interactions reported in the String database with a combined evidence score ≥0.4. Each module is identified by its number (specified in Supplementary MaterialsTables S2 and S3). The complete lists of the enrichments of all the modules are shown in Supplementary Materials Table S4.

