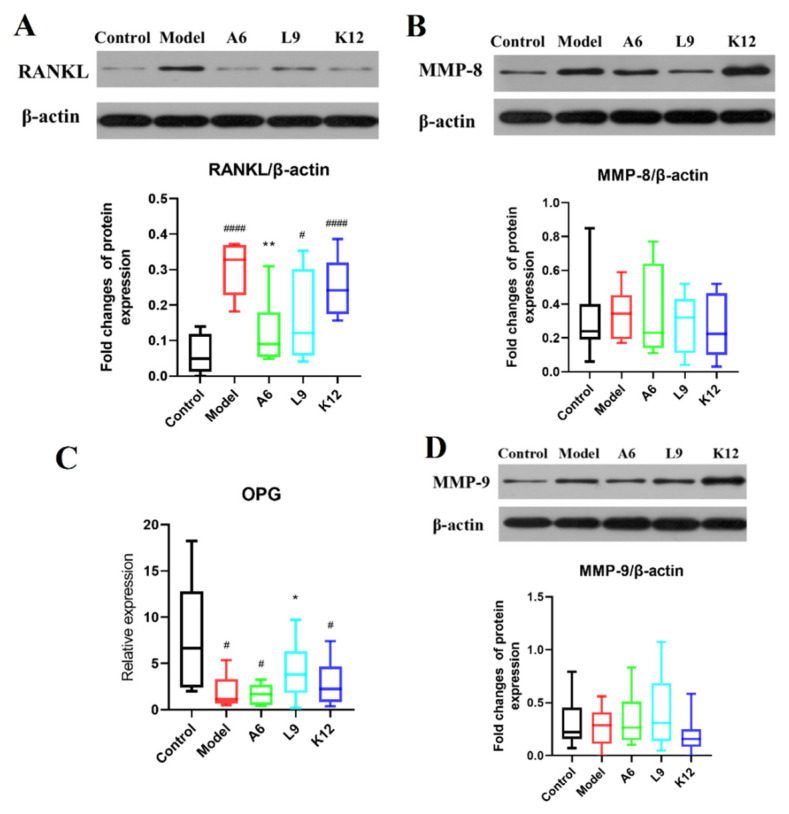
Figure 4.
The modulating effect of A6 or L9 on protein expression levels of key biomarkers in gingival tissues. (A,B,D) Representative analysis and densitometric quantification of Western immunoblot bands. (C) Relative expression of OPG as determined by RT-PCR. Values designated with a superscript * reflect comparisons with the model group, and values with a # are in relation to the control group (* p and # p < 0.05; ** p < 0.01; #### p < 0.0001).

