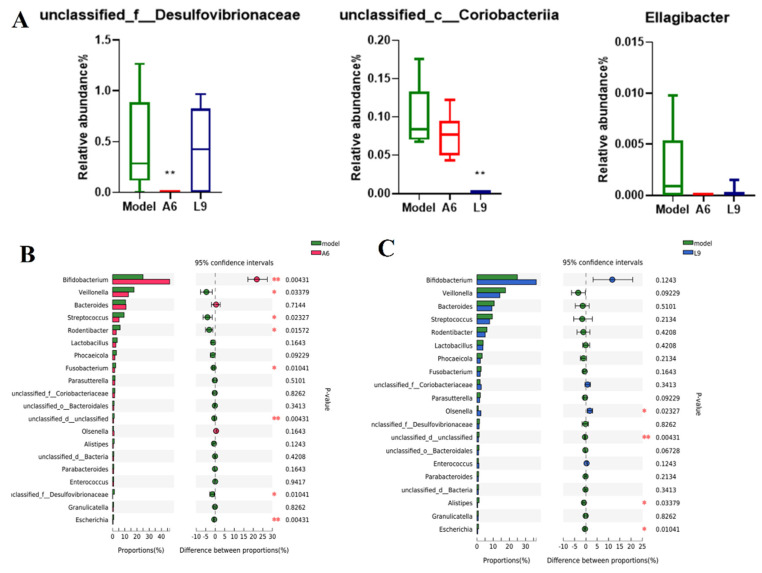
Figure 6.
Effects of A6 and L9 administration on abundance changes in characteristic taxa at the genus level. (A) Characteristic taxa derived from LEfSe analysis. (B) Difference comparisons of species abundances between A6 and model groups using the Wilcoxon-Mann-Whitney U test. (C) Difference comparisons of species abundances between L9 and model groups using Wilcoxon rank-sum/Mann-Whitney U test (* p < 0.05, ** p < 0.01).

