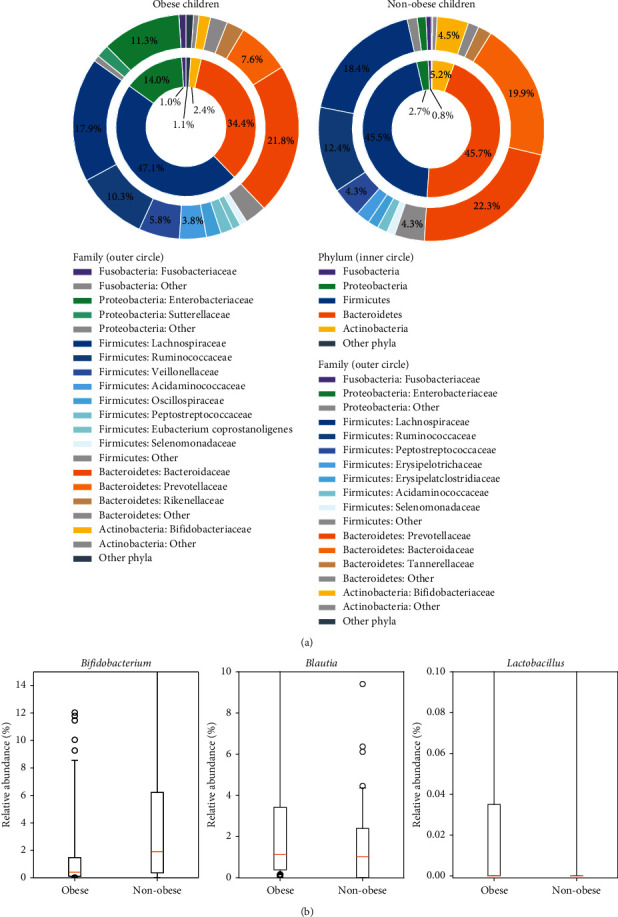
Figure 2.

The relative abundance of bacterial compositions in obese and nonobese children at the phylum and family levels is shown in (a). The inner circle demonstrates the composition at the phylum level, and the outer circle demonstrates the composition at the family level. In the obese children, the most abundant bacterial population at the phylum level was Firmicutes (47.1%). In the nonobese children, the dominant gut bacteria contained Firmicutes and Bacteroidetes of about 46.0%. The obese children contained significantly lower numbers of Bacteroidetes and Actinobacteria than nonobese controls (P < 0.001, Wilcoxon rank-sum test). Obese children showed a greater average proportion of Proteobacteria and Fusobacteria than nonobese children (P < 0.001). No significant difference in Firmicutes was observed between obese and nonobese children. The compositional differences in obese and nonobese children at the genus level are shown in (b). Orange lines indicate the median, and black boxes indicate the 1st–3rd interquartile range. Whiskers extend beyond the interquartile range by 1.5 times, starting from Q1 − 1.5∗(Q3 − Q1) to Q3+1.5∗(Q3 − Q1). Black circles indicate individual outlying data points. The relative abundance of Bifidobacterium was significantly higher in the nonobese children than in the obese children (P < 0.0001), but Blautia and Lactobacillus in the nonobese children were significantly lower than those in the obese children (P=0.0035 and P=0.0053).
