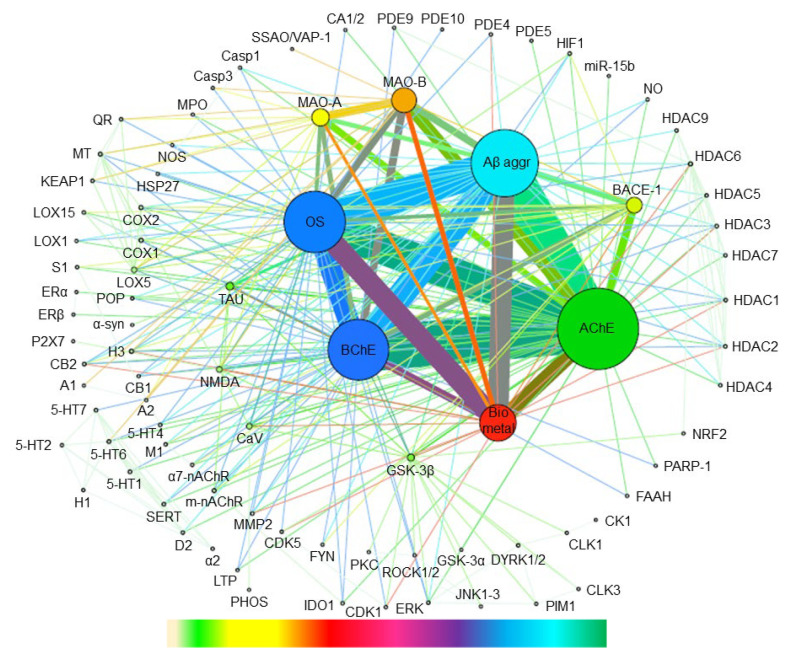
Figure 9.
Mapping of the binary combinations of biological targets that have been pursued in multitarget anti-AD compounds in the period 1990–2020. For the abbreviations of the names of the biological targets, see Table 1. Individual targets and binary combinations between targets appear as nodes and edges connecting each pair of nodes, respectively. The size of the nodes and the thickness of the edges are proportional to the number of times that each individual target appears in a binary combination and to the number of times that each binary target combination has been pursued, respectively. Color codes have been used to distinguish ranges of frequency in targets and target combinations: gradient bar chart (down), from lower frequency (left) to higher frequency (right).

