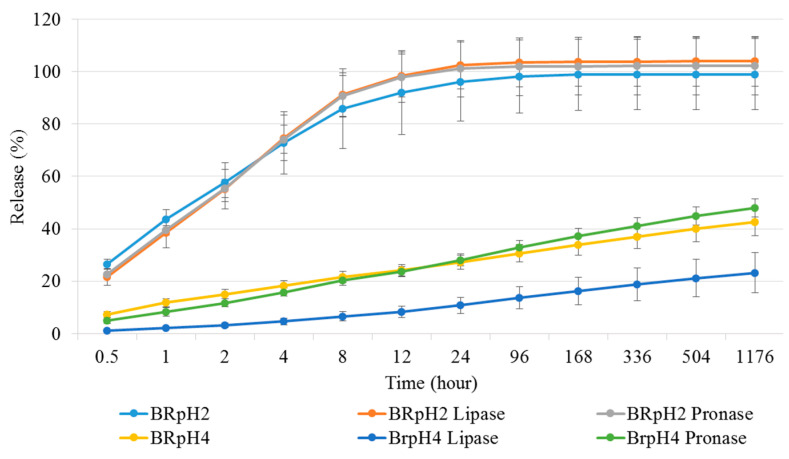
Figure 9.
Presentation of cumulative amounts of released drugs in different pHs, and with different enzymes by the accumulation of the released CHX in different measuring points and the relations to the entire drug contents. Values are expressed as sample means, error bars represent the standard deviation (SD) of three parallel measurements.

