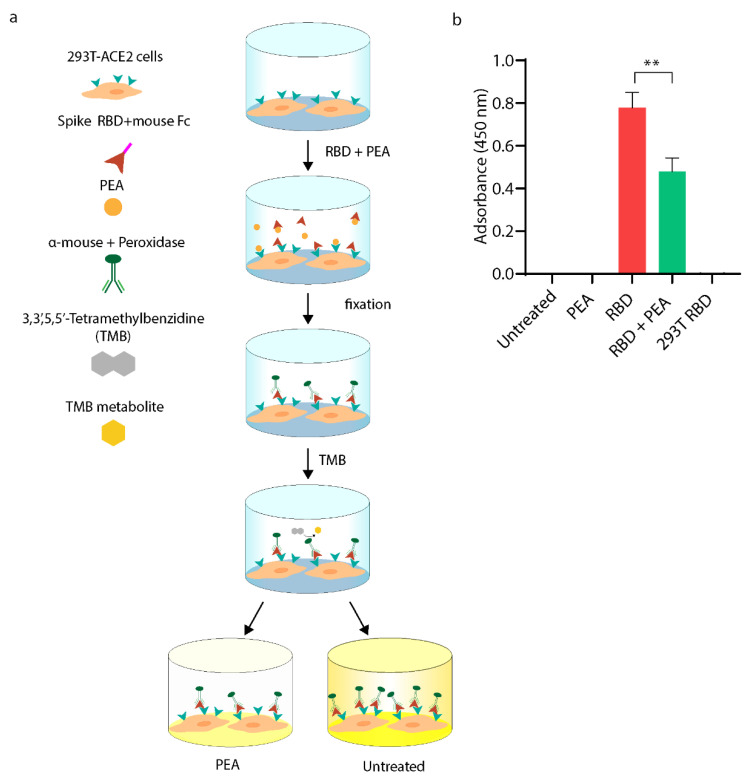
Figure 3.
Cell-based ELISA assay performed on 293T-ACE2 cells. (a) Schematic illustration of experimental workflow. Briefly, 293T-ACE2 cells were exposed to equimolar concentrations of PEA (10 μM) and recombinant SARS-CoV-2 RBD fused with murine Fc. Then, cells were fixed and stained with peroxidase-labeled α-mouse IgG. (b) Statistical analysis of cell-based ELISA assay shown in a. Data are expressed as means ± SD and were analyzed by a one-way ANOVA (N = 4, α = 0.05, ** p < 0.001).

