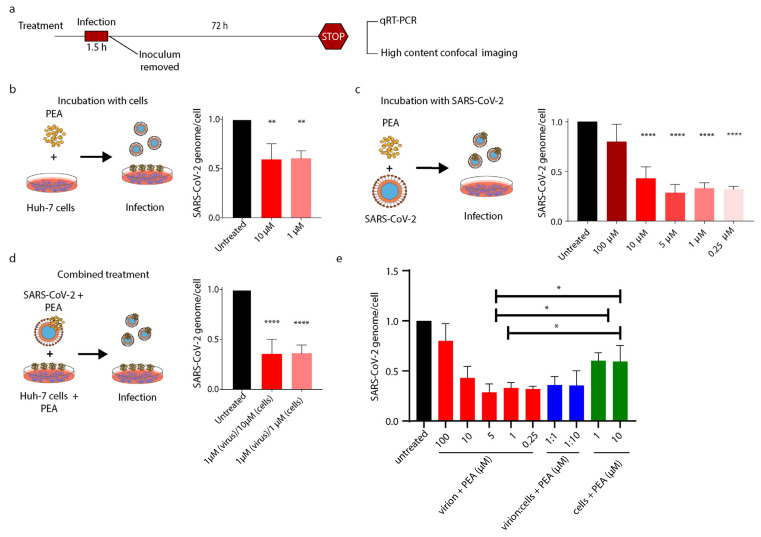
Figure 5.
PEA decreases entry of SARS-CoV-2. (a) Schematic illustration of experimental workflow and PEA treatment. (b) SARS-CoV-2 genome’s relative quantity in cells treated or not with PEA after infection. (c) SARS-CoV-2 genome’s relative quantity in cells infected with PEA-preincubated SARS-CoV-2 virions. (d) SARS-CoV-2 genome’s relative quantity in cells treated with a combination of previous treatments. (e) SARS-CoV-2 genome’s relative quantity in cells treated as described in b, c, and d. Data were normalized on β-actin content in cell lysates. Data are expressed as means ± SD and were analyzed using a one-way ANOVA (n = 3, * p < 0.5, ** p < 0.01; **** p < 0.0001).

