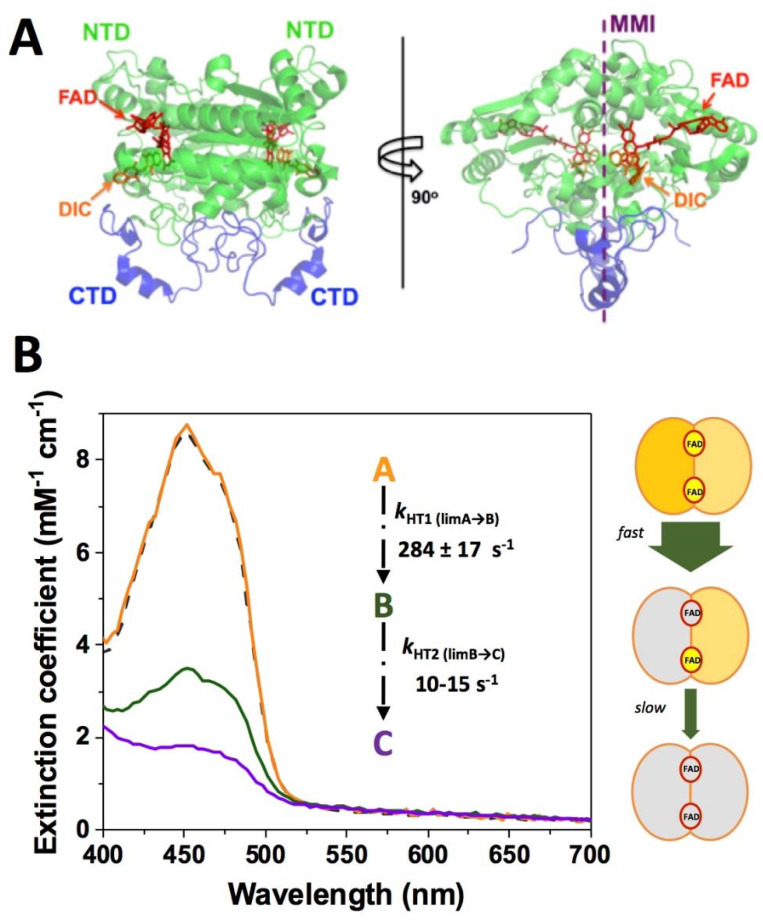
Figure 3.
Structure and catalytic function of NQO1. (A) Structural representation of the NQO1 dimer (PDB 2F1O) [83]. NTD and CTD refer to N-terminal and C-terminal domains, respectively. The location of the FAD and the inhibitor dicoumarol (DIC) binding sites is also indicated. The monomer:monomer interface is indicated as MMI. (B) Reduction of FAD by NADH shows two different pathways. In the left panel, the spectral properties of the different spectroscopic species (A, B, C) stabilized upon reduction are indicated as well as their conversion limiting rate constants. The right panel shows the model proposed by us for the sequential reduction of the two FAD cofactors in the protein homo-dimer, in which this large difference in kinetics represents a type of functional negative cooperativity. Adapted from [76].

