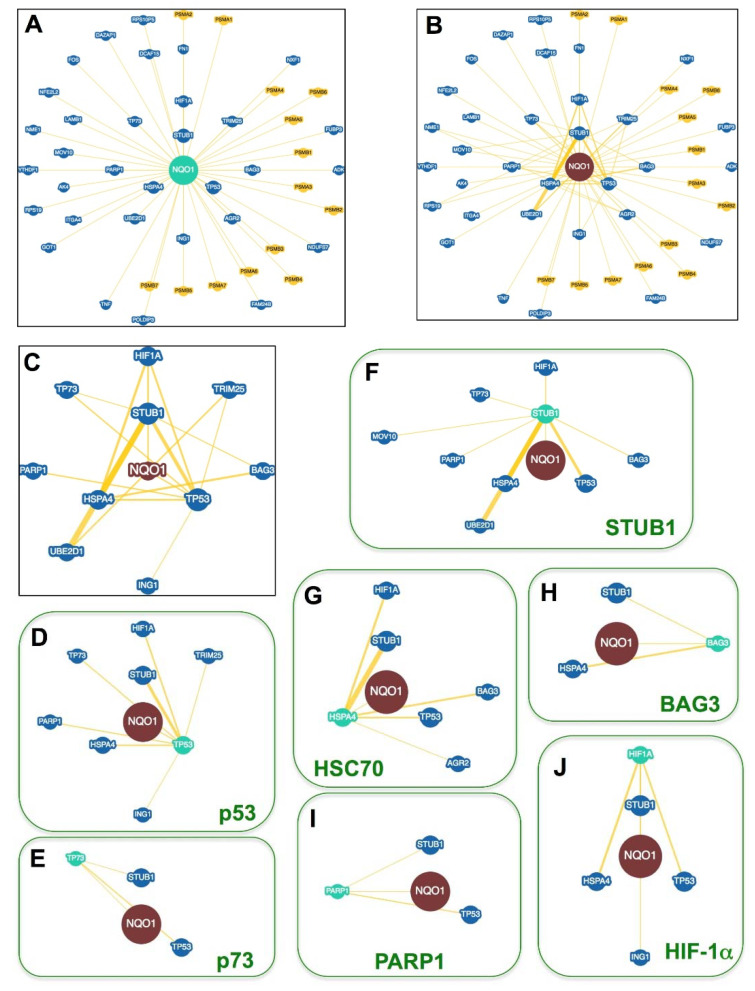
Figure 4.
The NQO1 interactome. (A) NQO1 protein partners described in at least one report. (B) Connectivity between NQO1 partners. The shorter the radial distance between a partner and NQO1 indicates a higher interconnectivity. Partners in yellow are from mouse and in blue from human. (C) A zoom from panel (B) shows the most highly interconnected partners of NQO1. (D–J) Interactions between NQO1 partners in panel (C) and other proteins to highlight their different interconnectivity. The thickness of connecting yellow lines is related to the number of reports describing the interaction. Data were retrieved from the BioGRID database (https://thebiogrid.org/108072, accessed on 1 April 2022) [111].

