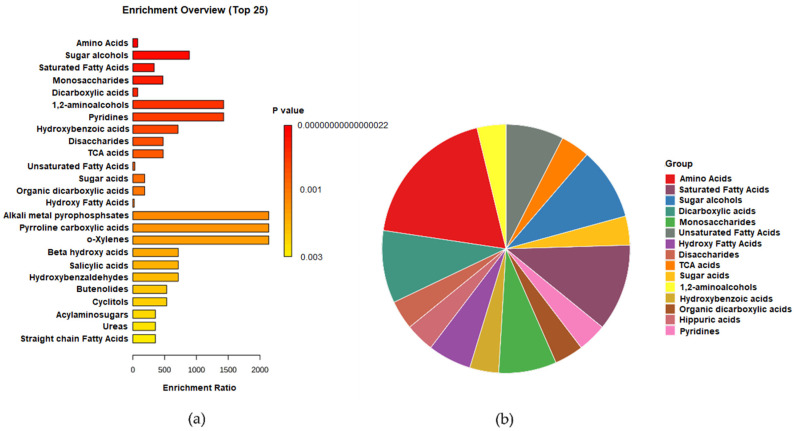
Figure 9.
(a) Over Representation Analysis (ORA) Bar chart and (b) pie chart of the chemical classification of the total metabolites identified in the five E. foeminea crude extract samples using GC–MS via metabolite set enrichment analysis (MSEA). Colors in the bar plot describe the p-value. The red and orange colors signify the high and low values, respectively. The lines indicate the enrichment ratio, which was computed by hits/expected, where hits = observed hits and expected = expected hits. The colors in the pie chart designate each chemical group relative to the total number of compounds.

