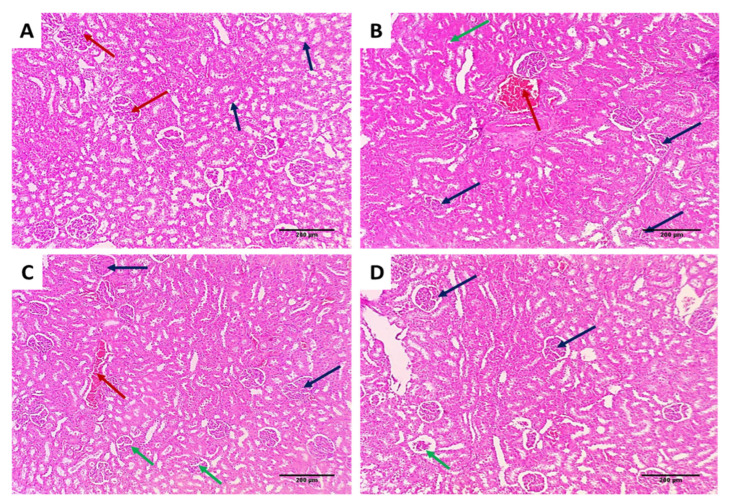
Figure 8.
H&E-stained kidney sections of (A) normal kidney tissues (negative control) showing average-sized glomeruli (red arrows) surrounded by average-sized tubules lined with columnar cells (blue arrows) (×100); (B) group I showing vascular congestion (red arrow) surrounded by atrophic glomeruli (blue arrows) and focal degenerated tubules (green arrow) (×100); (C) group II showing focal vascular congestion (red arrow) surrounded by normal-sized glomeruli (blue arrows) and some atrophic glomeruli (green arrows) surrounded by average-sized tubules (×100); (D) group III shows average-sized glomeruli (blue arrows) and one atrophic glomerulus (green arrow) surrounded by average-sized tubules (×100).

