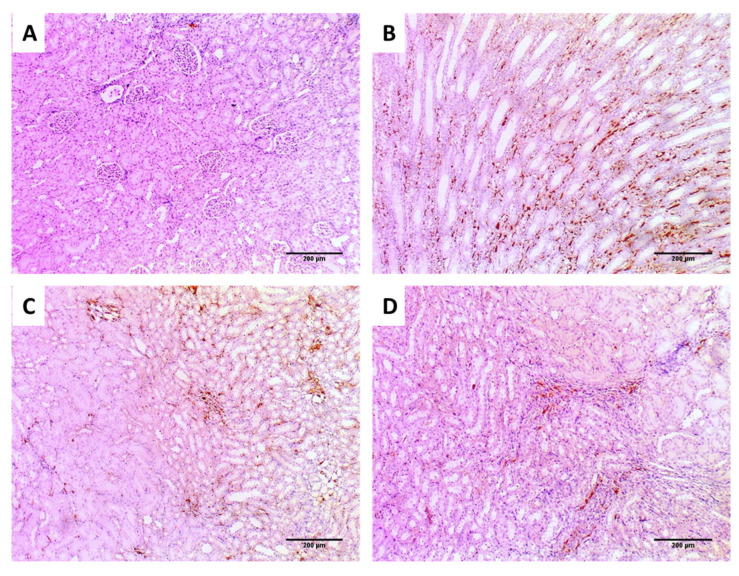
Figure 10.
Tumor necrosis factor-alpha (TNF-α) immunohistochemical staining of the kidney sections of (A) normal kidney tissues (negative control) showing negative TNF-α staining, with score (0) (×100); (B) group I showing strong TNF-α staining with score (3) (×100); (C) group II showing moderate TNF-α staining with score (2) (×100); (D) group III showing weak TNF-α staining with score (1) (×100).

