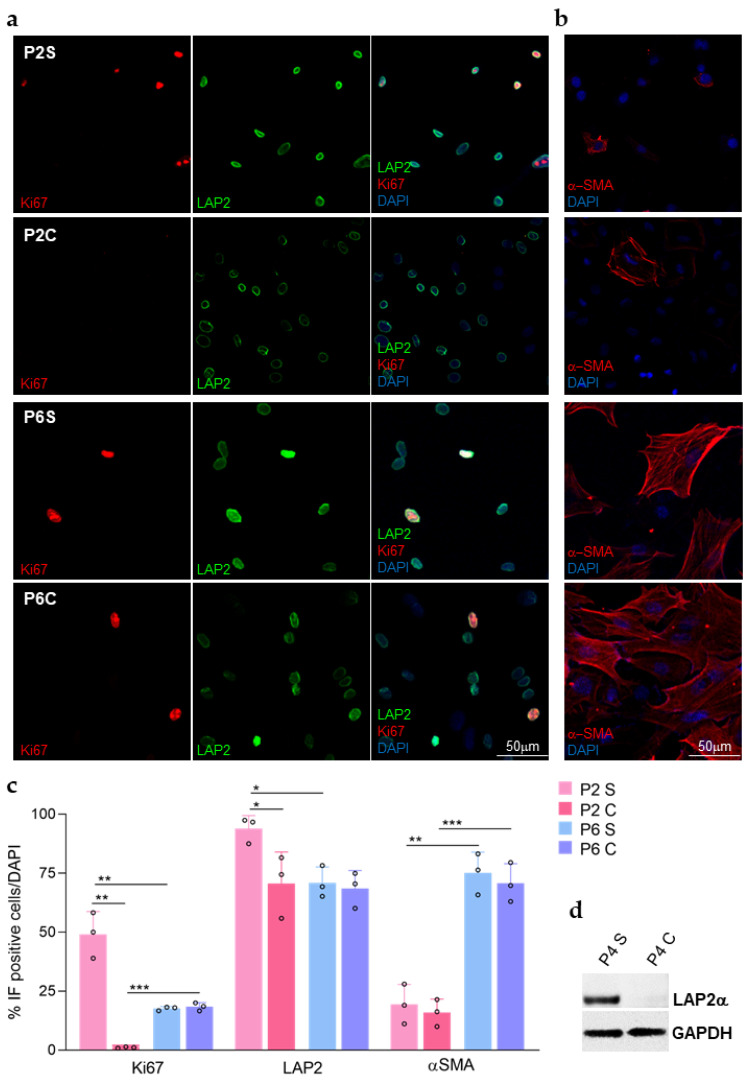
Figure 2.
LAP2 protein increases in rCEnCs at S only at low passages. (a) Representative images of ki67 (red) and LAP2 (green) immunofluorescence staining of rCEnC at P2 S_C and P6 S_C. DAPI (blue) counterstained nuclei. (b) Representative images of αSMA (red) immunofluorescence staining of rCEnC at P2 S_C and P6 S_C. DAPI (blue) counterstained nuclei. (c) Quantification of immunofluorescence staining shown in (a,b). Data are presented as mean ± SE. The statistical significance was determined by Students’ t-test. * p-value < 0.05. ** p < 0.01. *** p < 0.001. (d) Western Blot analysis showing LAP2α expression on rCEnC P4 S_C. GAPDH was used as internal control.

