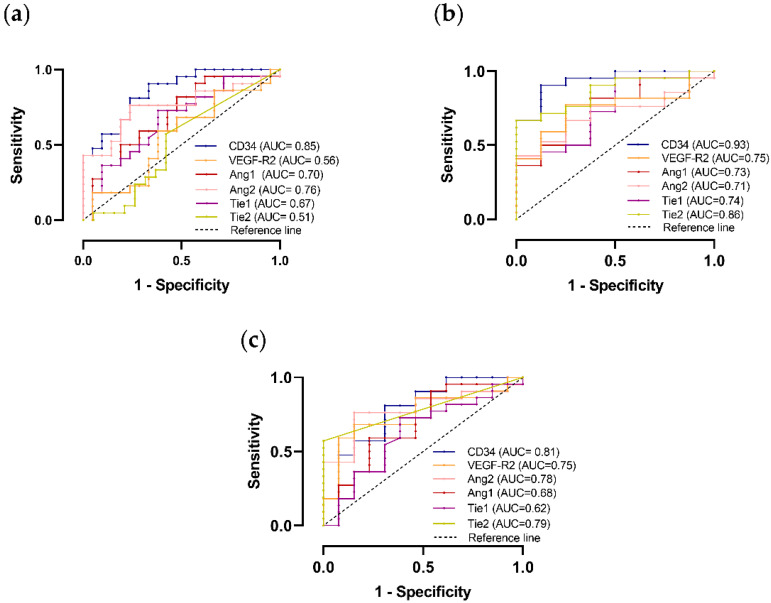
Figure 5.
Graphic representation of ROC curve to distinguish adrenocortical carcinoma (ACC) and total adrenocortical adenomas (ACAt) (a); ACC and adrenocortical adenoma with Cushing syndrome (ACAc) (b); ACC and non-functioning adrenocortical adenoma (ACAn) (c) with the respective area under the curve (AUC).

