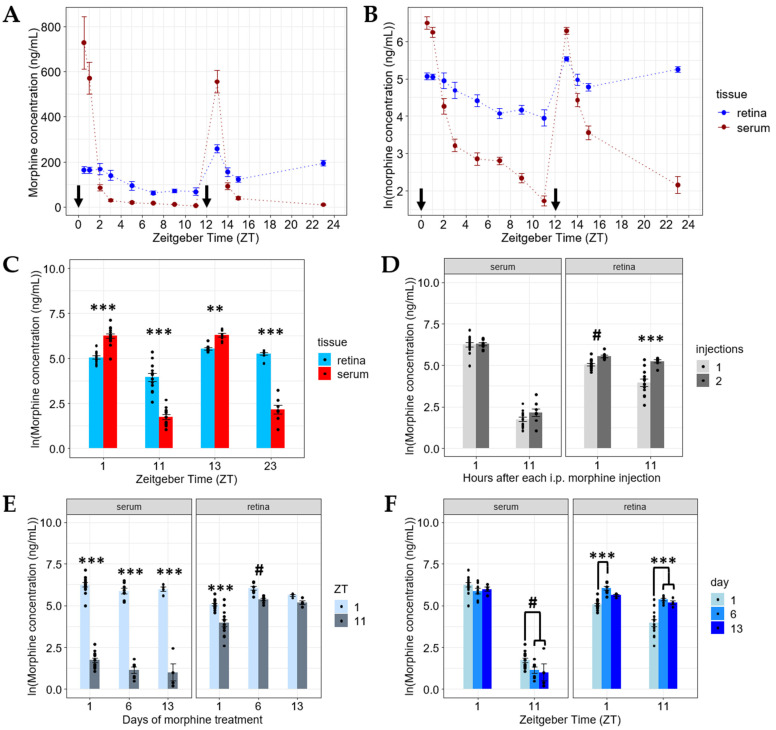
Figure 2.
Morphine accumulates in the retina following repeated systemic exposure. (A) Morphine pharmacokinetics in retina and serum following 20 mg/kg i.p. morphine injections at ZT 0 and ZT 12 (indicated by arrows). (B) Morphine concentrations in retina and serum following systemic injections at ZT 0 and ZT 12 (indicated by arrows) on the natural logarithmic (ln) scale. Significant differences exist between the retina and serum within each measured time point (p < 0.01). Two-way ANOVA was used with a Tukey post hoc adjustment for the ln scale. (C) Morphine concentration in the serum is higher than in the retina 1 h (ZT 1 and ZT 13) after 20 mg/kg i.p. morphine injections at ZT 0 and ZT 12 (at the selected time points from the data shown in B). However, the retinal morphine levels exceed the serum levels at 11 h after systemic exposure (ZT 11 and ZT 23). Two-way ANOVA with a tissue x ZT interaction and a Tukey post hoc adjustment was performed on the ln scale. (D) Serum morphine pharmacokinetics remain the same at 1 and 11 h after one and two 20 mg/kg i.p. morphine injections, while the retinal morphine levels increased following the second injection at those same time points. Three-way ANOVA with a tissue x hours post-injection x injection number interaction and a Tukey post hoc adjustment was performed on the ln scale. (E,F) Morphine appears to accumulate in the retina following 6 or 13 days of chronic systemic morphine treatment, while the serum pharmacokinetics remain similar for ZT 1 and ZT 11. Three-way ANOVA with a tissue x ZT x day interaction using a Tukey post hoc adjustment was performed on the ln scale. (# = p < 0.05, ** = p < 0.001, *** = p < 0.0001). Data are presented as the mean ± SEM.

