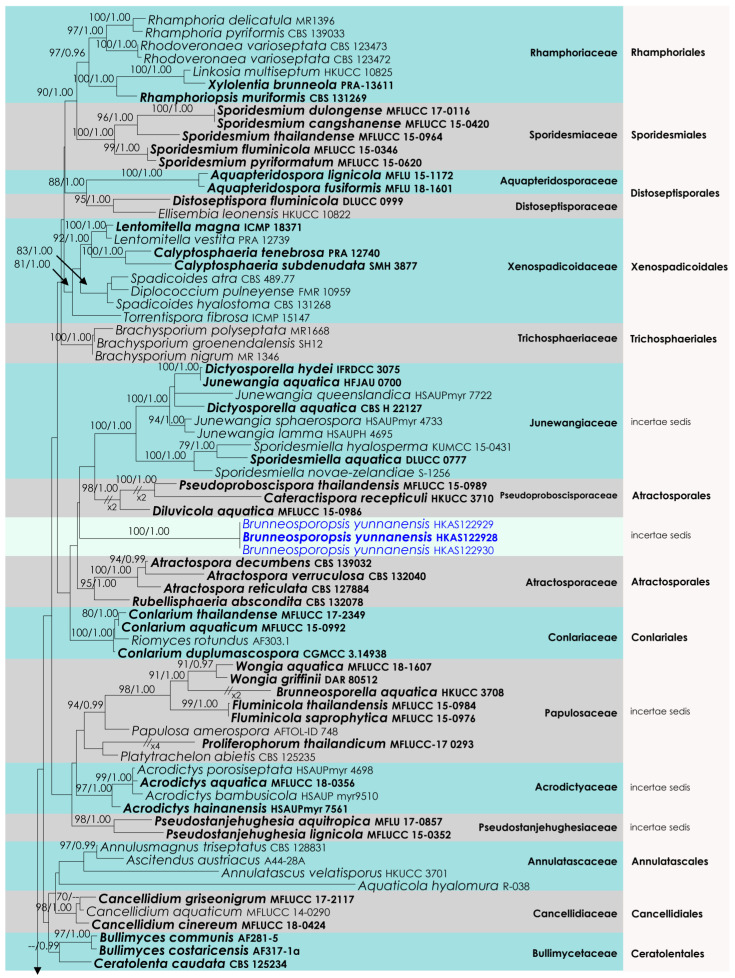
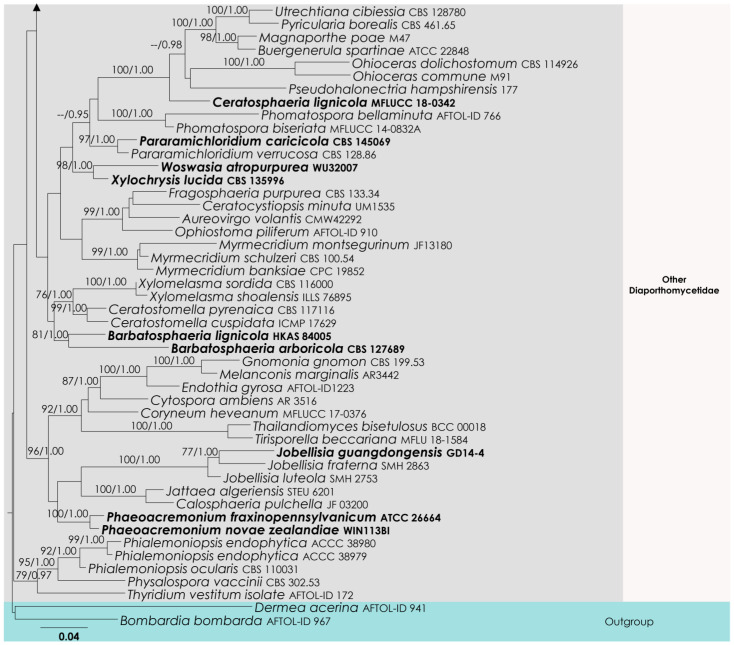
Figure 3.
RAxML tree based on an integrated dataset of partial LSU + SSU + tef1-α DNA sequence analysis in Diaporthomycetidae. Bootstrap support values for ML equal to or greater than 50% and BYPP equal to or greater than 0.95 are shown as ML/BI above the nodes. Blue represents new isolates. Species names given in bold indicate ex-type and ex-paratype strains. The scale bar represents the expected number of nucleotide substitutions per site.


