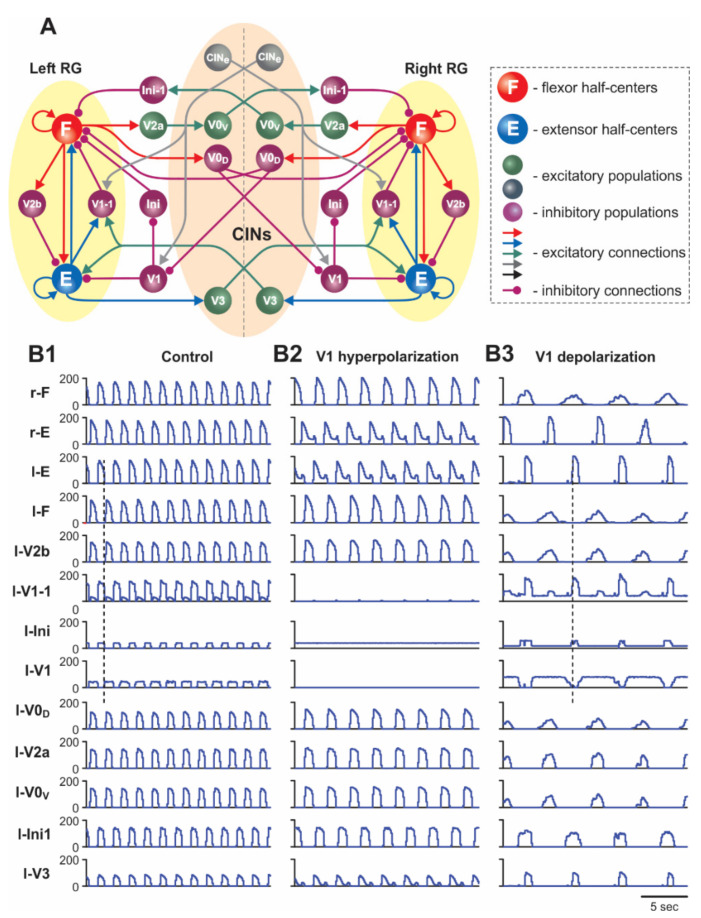
Figure 1.
(A) Model schematic. (B1–B3) Model performance in control conditions (B1), after hyperpolarization of V1 neurons (B2), and after depolarization of V1 neurons (B3). Activity profiles of populations in this and the following figures are shown as average histograms of neuron activity (spikes/(N × s), where N is the number of neurons in a population; bin = 100 ms). In (B1–B3), activities of the F and E half-centers and left (l-) interneuron populations are shown at = 0.17. The dashed line in (B1) indicates the beginning of left flexion, and in (B3) the beginning of left extension.

