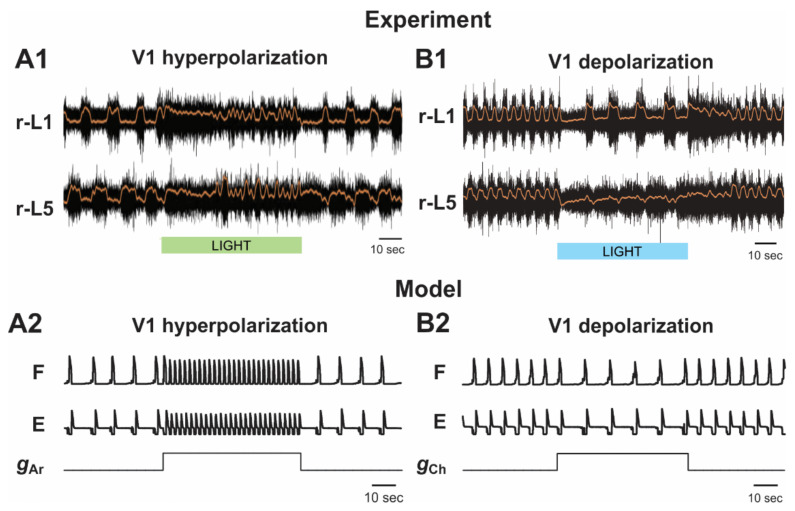
Figure 7.
Effects of the selective hyperpolarization and depolarization of V1 neurons on drug-induced fictive locomotion in the isolated hemicord. (A1,B1) Fictive locomotor activity recorded from lumbar roots (black traces) of isolated hemicord overlapped with the slow potentials obtained by low pass filtration of raw traces (orange lines). The V1 hyperpolarizing and V1 depolarizing light stimulations (duration 60 s) are shown by green (in A1) and blue (in B1) bars, respectively. (A1) reproduced from Falgairolle and O’Donovan [35], their Figure 9A, under CC-BY license. (B1) reproduced from Falgairolle and O’Donovan [36], their Figure 3A, under CC-BY license. (A2) and (B2) The results of our simulation of hyperpolarization (A2) and depolarization (B2) of all V1 neurons during drug-induced fictive locomotion in the hemicord. All traces show integrated activity profiles of the F and E populations before, during, and after increasing or (lower stepwise trace) to simulate V1 hyperpolarization and depolarization, respectively. In (A2), was increased to 7.0 mS/cm2. In (B2), was increased to 0.7 mS/cm2. α = 0.18 in (A2) and 0.2 in (B2).

