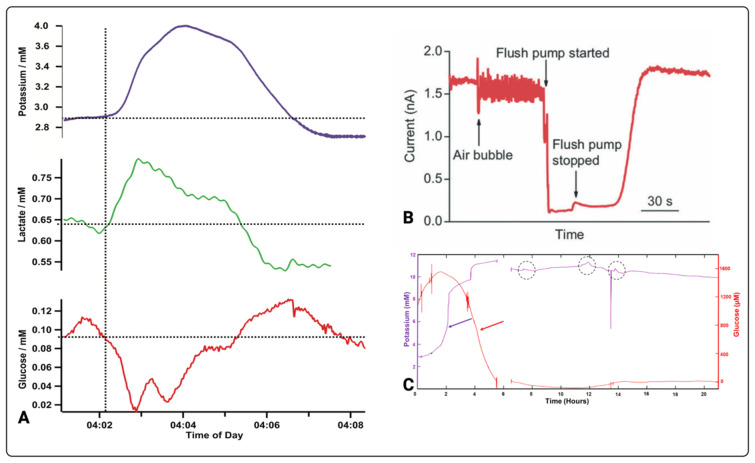
Figure 5.
Brain metabolic changes measured by electrochemical biosensors. (A) Potassium, glucose, and lactate changes over time in a TBI patient [50]. (B) Microdialysate measurements affected by an air bubble [94]. (C) Simultaneous glucose and potassium changes over time in a patient 6 days after a TBI. The dotted circles indicate potassium transients while the red allows indicates glucose decline in relation to potassium rise (purple arrow) [51]. Images (A–C) originally appeared in [50], [94] and [51] respectively, published Open Access CC BY [50,94] and CC BY-NC-ND [51], copyright The Authors.

