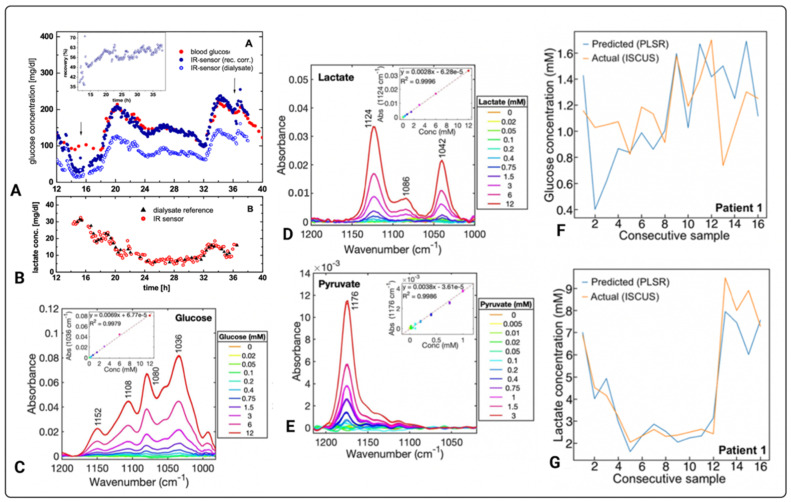
Figure 7.
Measurements of various metabolites using optical biosensors. Glucose (A) and lactate (B) continuous measurements of concentration versus time, determined in a type 1 diabetic subject. The inset graph within (A) shows % recovery versus time [69]. The arrows within (A) indicate the time between which the tissue lactate concentrations in (B) were also followed. (C) Glucose, (D) lactate, and (E) pyruvate MIR measurements of absorbance vs. wavenumber (cm−1) for different concentrations of pure standards, whereby the insets are standard calibration curves of three replicates at specific wavelengths of each metabolite. (F,G) compare consecutively pooled microdialysate measurements of one TBI patient acquired by an optical based sensor to routinely used ISCUSflex microdialysis analyser where glucose and lactate was detected. The diagrams in (A,B) are published with permission of the Publisher and Corresponding Author*; they originally appeared in T. Vahlsing, S. Delbeck, J. Budde, D. Ihrig, and H. M. Heise*. Combination of micro-dialysis and infrared spectroscopy: a multi-analyte assay for accurate biofluid analysis and patient monitoring. Biomedical Vibrational Spectroscopy 2016: Advances in Research and Industry, edited by A. Mahadevan-Jansen, W. Petrich, Proc. of SPIE Vol. 9704, 97040R. © 2016 SPIE·CCC code: 1605–7422/16/$18, doi: 10.1117/12.2214636 [69]. Images (C–G) originally appeared in [49], published Open Access CC BY, copyright The Authors.

