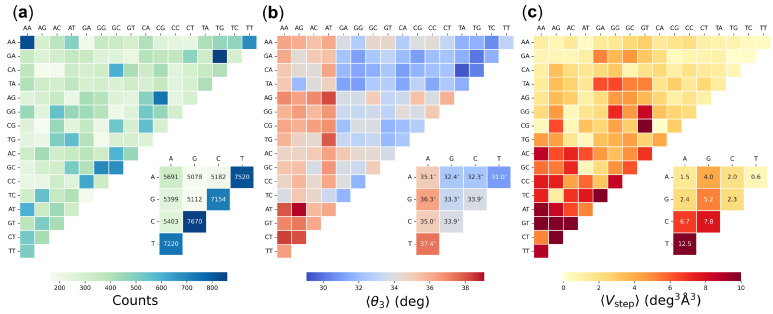
Figure 4.
Color-coded heat maps of (a) the number of base-pair steps, (b) the average twist angle between successive base pairs, and (c) the average volume of configuration space accessible to DNA dimers in all unique tetrameric contexts. Data organized such that purine–purine steps lie at the top left of each grid, purine–pyrimidine steps at the lower left, and pyrimidine–purine steps at the top right. Values collected from 3923 high-resolution protein–DNA structures available in February 2022. Dimer values in numbered boxes are averages of the mean values found for each base-pair step in all 16 tetrameric contexts. See Table S4 for numerical values and Methods for details.

