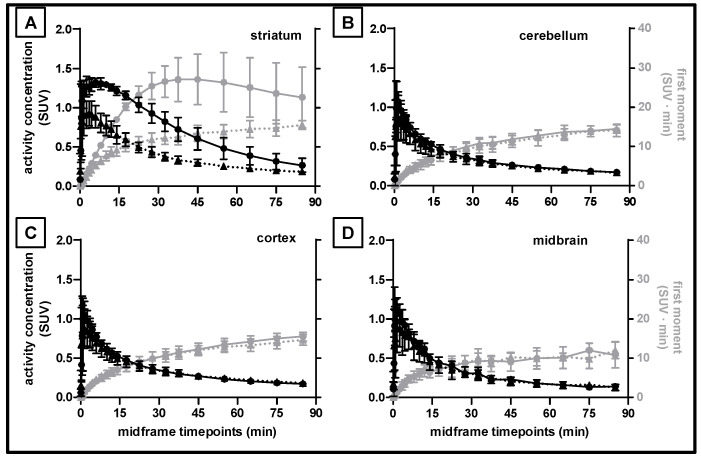
Figure 5.
[18F]FLUDA mean time–activity curves in standardised uptake values (SUV; black lines) and corresponding first moment curves (grey lines) in different brain regions of pigs with (solid lines, circles) and without (dashed lines, triangles) injection of tozadenant. (A) striatum, (B) cerebellum, (C) cortex, and (D) midbrain; n = 3, mean ± SD.

