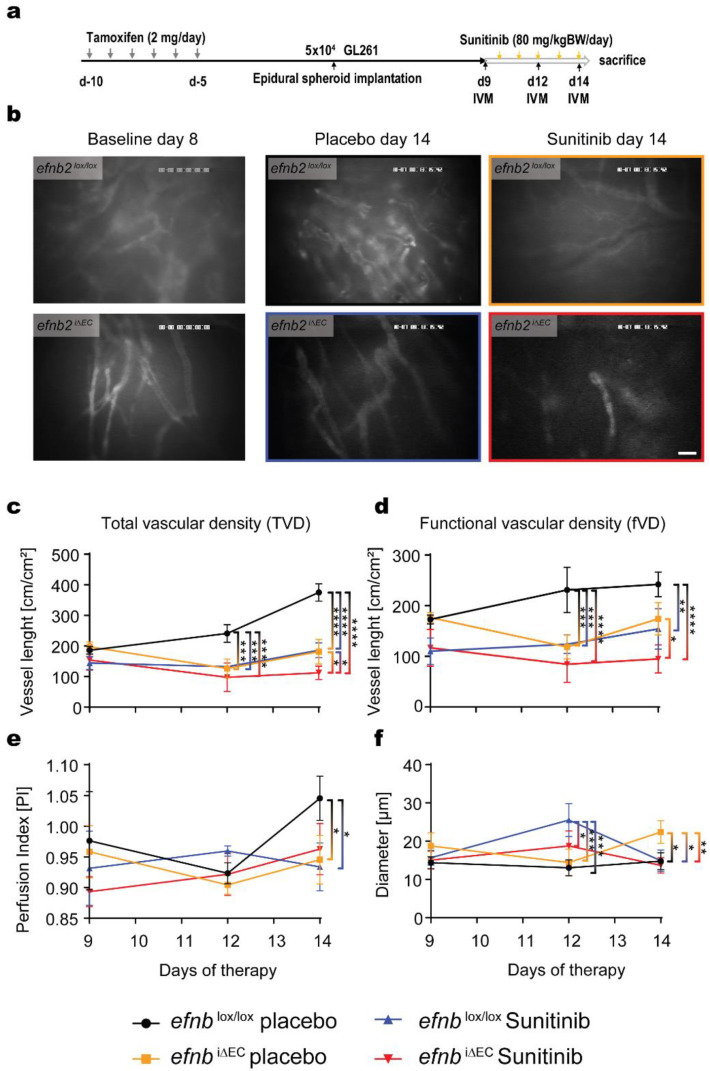
Figure 4.
Intravital fluorescence microscopy visualization of efnb2i∆EC vasculature in glioma. (a) Experimental design and procedure of the Intravital microscopy (IVM) experiments. (b) Exemplary images of vascular architecture in control and efnb2i∆EC animals 14 days after tumor cell implantation with placebo or sunitinib therapy, respectively (scale bar: 60 µm). (c) Total vascular density (tVD) quantified in control and efnb2i∆EC animals revealed a significant difference in placebo control tumors 12 and 14 days (*** p = 0.0005 and **** p < 0.0001) after implantation. Sunitinib therapy showed a significant effect in control animals at both timepoints (*** p = 0.0003 and **** p < 0.0001). Sunitinib therapy in efnb2i∆EC animals significantly reduced TVD at day 14 compared to sunitinib control efnb2lox/lox and placebo efnb2i∆EC animals (* p = 0.036 and * p = 0.0229). Reduced TVD in placebo control animals was found on day 12 and 14 after tumor implantation (*** p < 0.0001 and **** p < 0.0001). (d) Functional vascular density (fVD) quantified showed a significant therapeutic difference in control tumors after 12 days (*** p = 0.0005) and recovery after 14 days. Endothelial ephrinB2 depletion (efnb2i∆EC) reduced fVD 12 and 14 days after surgery (*** p = 0.001 and ** p = 0.0072) with an add on effect observed under sunitinib therapy (day 12: **** p < 0.0001, day 14 **** p < 0.0001). EphrinB2 depletion in endothelial cells (efnb2i∆EC) showed an additional fVD reduction 14 days after tumor implantation (* p = 0.0175). (e) Blood perfusion index (PI) shows no difference until 5 days of therapy where control placebo perfusion is significantly higher compared to the efnb2lox/lox sunitinib group (* p = 0.0396) and efnb2i∆EC placebo animals (* p = 0.0172). (f) EphrinB2 knockout animals (efnb2i∆EC placebo) show a significant increase in diameter 12 days after tumor cell implantation (efnb2lox/lox placebo: *** p = 0.0001, efnb2lox/lox sunitinib: *** p = 0.0005 and efnb2i∆EC sunitinib: * p = 0.0484). Two days later this increase is normalized and only the efnb2lox/lox sunitinib group showed a significant increase in diameter (efnb2lox/lox placebo: * p = 0.0212, efnb2i∆EC placebo: * p = 0.0240, efnb2i∆EC sunitinib: ** p = 0.0067, (c–f): two-way ANAOVA analysis, Sidak’s multiple comparisons test used for all statistics).

