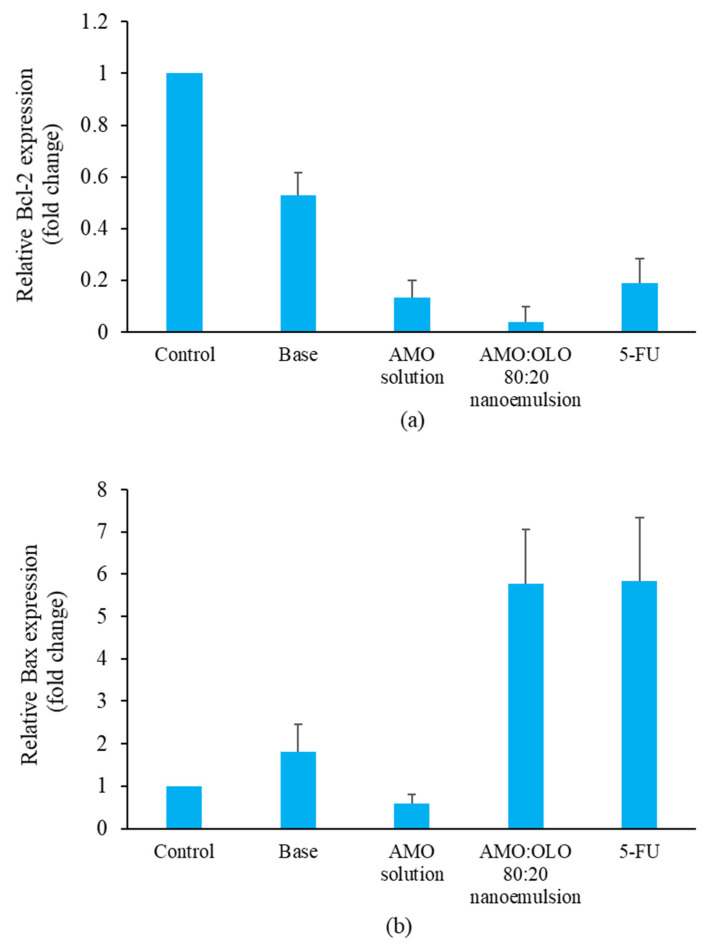
Figure 8.
Relative Bcl-2 expression levels by qPCR (a) and relative Bax expression levels using qPCR (b) after induction with base (10% w/w of Kolliphor EL), AMO solution (at concentrations equivalent to that used in the nanoemulsions), AMO:OLO 80:20 nanoemulsion at an IC60 concentration and 30 µg/mL of 5-FU. The values are shown as mean ± SD (n = 3).

