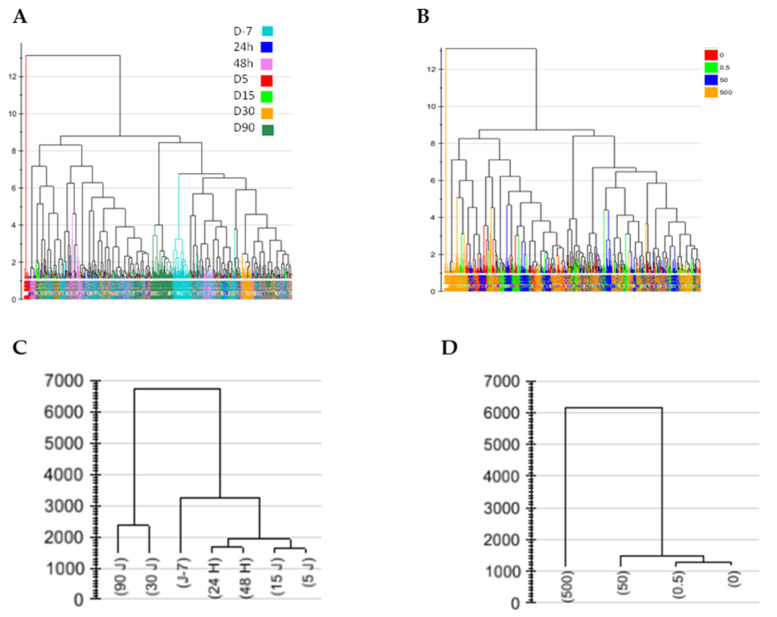
Figure 2.
Hierarchical clustering of observations based on the 30 principal component analyses (A,B) or 10 (C) or 20 (D) PLS-DA components performed on all urine sampling times and NU doses. Each component influence is weighted according to its respective eigenvalue. Hierarchical classification analysis with Ward as the clustering method and tree sorted by size. In (A), sample colors correspond to sampling times; in (B), sample colors refer to NU doses. (C,D) represent the c(corr) vector, showing how well the X variables (mass features intensity) fit with the Y variables (either time factor in (C) or the dose factor in (D)). This vector can be seen as the barycenter of each time group or NU dose group. In (C), the time response was highly significant in PLS-DA analysis (P after cross-validation ANOVA = 0), whereas in (D), the dose response was not (P after cross-validation ANOVA = 1).

