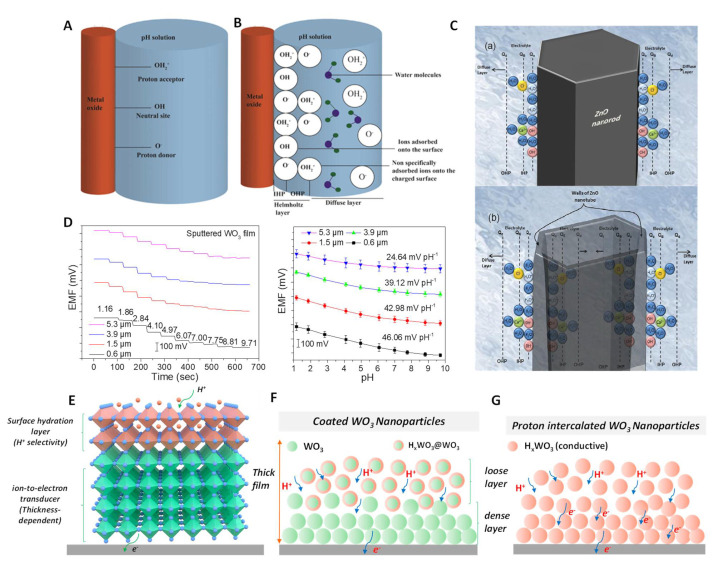
Figure 5.
pH response mechanism for MOx. (A) Schematic representation of the site–binding theory to illustrate the response mechanism for MOx–based pH sensors. (B) The formation of the EDL structure on the surface of MOx. Reprinted with permission from [34], Copyright (2020) Elsevier. (C) Schematic illustration of the charge distribution at ZnO for (a) nanorod and (b) nanotube structures. Reprinted with permission from [98], Copyright (2009) MDPI. (D) The thickness dependence of pH sensitivity for WO3. (E) pH response model according to typical SC–ISEs, including the surface hydration layer (H+ recognition) and bulk ion–to–electron transducer layer. (F) Limited hydration for coated WO3 nanoparticles. (G) Complete hydration by the proton intercalation of WO3. Reprinted with permission from [109], Copyright (2022) John Wiley and Sons publications.

