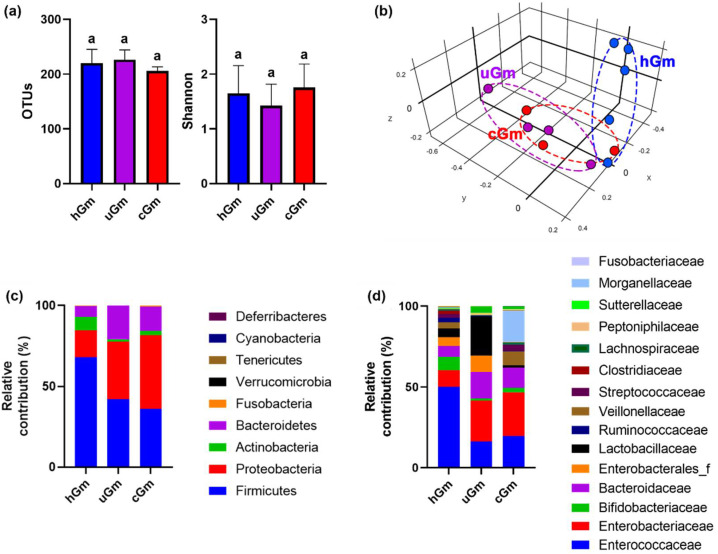
Figure 4.
The microbiota composition of hGm and iGm. Effects on α-diversity (OTUs and Shannon index) (a) and β-diversity (principal coordinate analysis (PCoA) plot based on BrayCurtis) (b). Effect on the microbiota composition at the phylum (c) or family levels (d). Data values are as mean ± SD (n = 8). Groups with same letters are not significantly different (p < 0.05).

