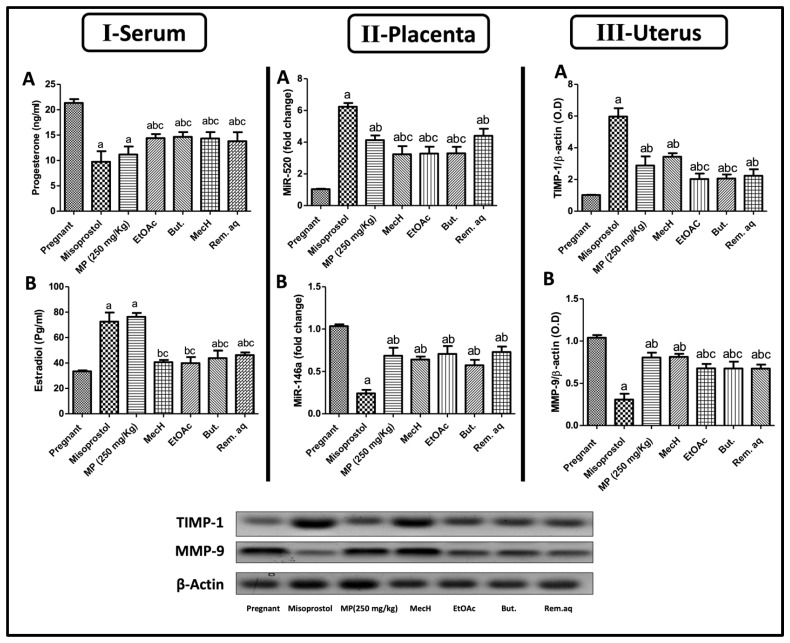
Figure 3.
The serum levels of (A) progesterone and (B) estradiol (Panel I). Placental protein expression of (A) MiR-520 and (B) MiR-146a (Panel II). Uterine protein expression of (A) TIMP-1, (B) MMP-9 (Panel III). Values are presented as mean (n = 6) ± SD and statistical analysis was carried out using one-way ANOVA followed by Tukey’s post hoc multiple comparison test. As compared with control (a), misoprostol (b), MP (c); p < 0.05. But.: butanol; EtOAc: ethyl acetate; MecH: methylene chloride; MiR-520: micro ribonucleic acid-520; MiR-146a: micro ribonucleic acid-146a; MMP-9: matrix metalloproteinase-9; MP: Mentha pulegium L.; TIMP-1: tissue inhibitor matrix metalloproteinase-1; Rem. aq.: remaining aqueous.

