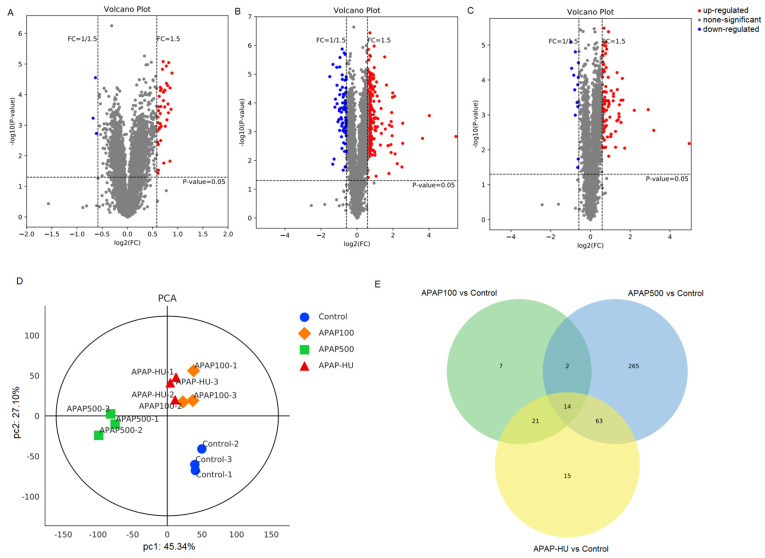
Figure 4.
Volcano plot, principal component analysis (PCA), and Venn diagram for 200 differentially expressed proteins of macrophages treated with acetaminophen (APAP) in the presence or absence of polydatin (HU). (A) APAP100 vs. control group, (B) APAP500 vs. control group, (C) APAP500-HU vs. control group. Gray represents proteins without significant differences; blue represents differential proteins significantly downregulated; and red represents differential proteins significantly upregulated. (D) PCA plot in which each point in the coordinate system represents a single replicate in a grouped experiment, and different colors distinguish different groups. (E) Venn diagram.

