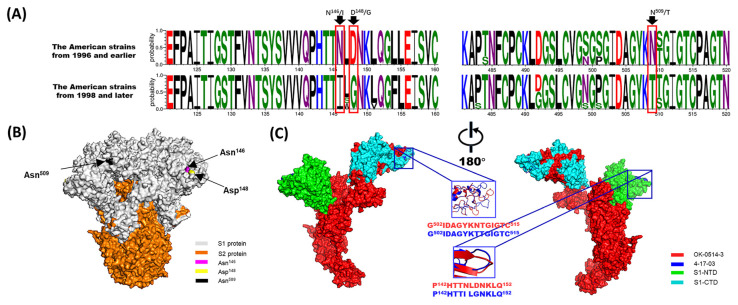
Figure 3.
Analysis of amino acid mutations in the BCoV S protein. (A) Divergence analysis of the S proteins between the American strains from 1996 and earlier and from 1998 and later. (B) A predicted 3D structural model of the OK-0514-3 strain S protein was generated and observed on the front sides. Note: The S1 and S2 proteins are colored gray and orange, respectively. Amino acids 146, 148, and 509 are colored magenta, yellow, and black, respectively. (C) A comparative analysis of the predicted S-protein modeling of the OK-0514-3 and 4-17-03 (representative strain of the American strains from 1996 and earlier and from 1998 and later, respectively). Note: The OK-0514-3 strain is shown as the surface and in red in the illustration. The mutant amino acid residues of the S protein of the 4-17-03 strain are shown as the surface and in blue in the illustration. The N-terminal domain of the S1 subunit (S1-NTD: residues 15–298) and C-terminal domain of the S1 subunit (S1-CTD: residues 326–540) proteins are shown as the surface in green and cyan, respectively.

