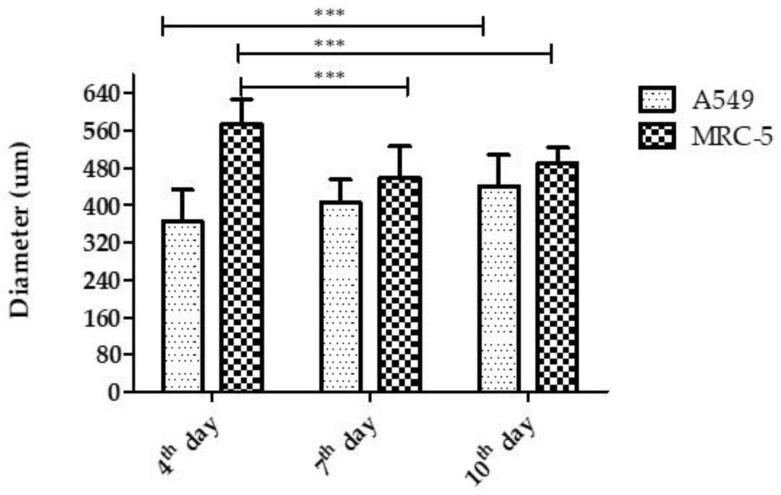
Figure 3.
Diameter of the spheroids of the A549 and MRC-5 cell lines on the fourth, seventh, and tenth day of formation. Values expressed as mean and standard deviation. Statistical differences between the A549 cell line from the fourth day in relation to the tenth day and for the MRC-5 cell line from the fourth day in relation to the seventh and tenth day. *** p < 0.001.

