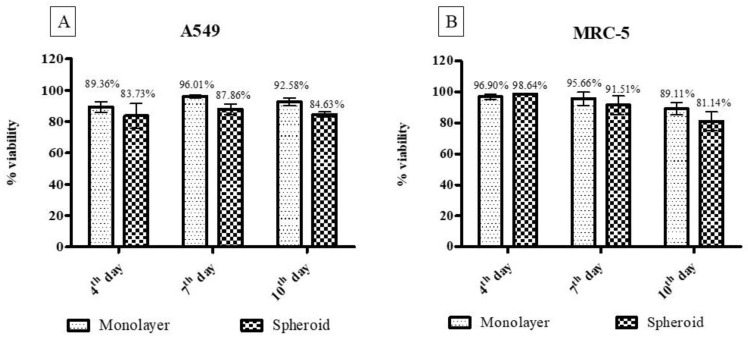
Figure 4.
Cell viability results from the trypan blue method. In Figure (A), the comparative values between the monolayer and three-dimensional model for the A549 cell line are shown, and in (B), the same comparative results for the MRC-5 cell line are shown. There was no statistically significant difference.

