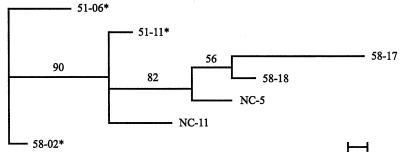
FIG. 4.
Phylogram of the seven highly toxic strains of S. chartarum. The phylogram presented is the most parsimonious tree inferred from the binary data (Table 5) by using the branch-and-bond option in PAUP 3.1. The scale bar represents the distance resulting from one character change. Distance analysis of the data set was performed in PAUP to determine which strain was the least similar. This strain was used as the outgroup in the phylogenetic evaluation. Values appearing above the branches are percentages of 1,000 bootstrap analysis replicates in which the branches were found. Only percentages greater than 50% are shown. A strain number followed by an asterisk indicates a strain that came from an IPH case house in Cleveland. Strains 51-06 and 58-02 were significantly different from the other highly toxic strains, as indicated by the 90 on the line connecting to the rest of the strains.

