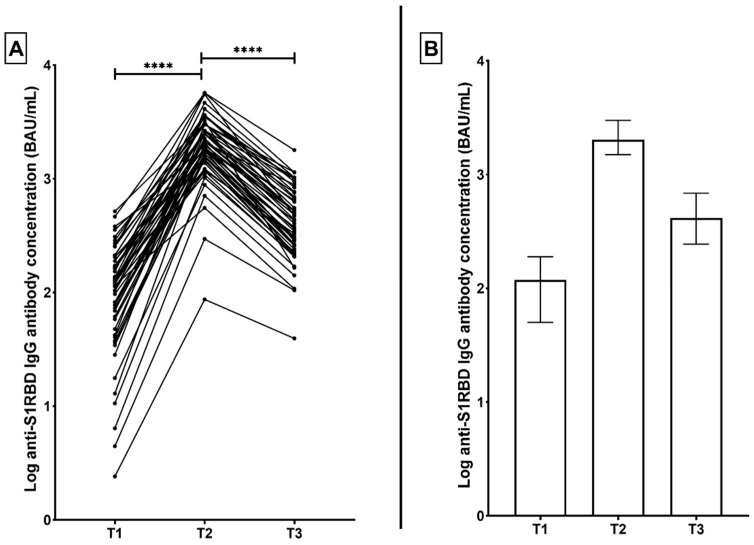
Figure 1.
(A) Correlation graph representing the change in anti-S1RBD IgG antibody concentrations in BNT162b2 -vaccinated participants (PfVac) across three time points; 3 weeks after the first vaccination dose (T1), 3 weeks after the second dose (T2), and 3 months after the second dose (T3). (B) corresponding distribution graph with bars representing median and interquartile range. **** p < 0.0001.

