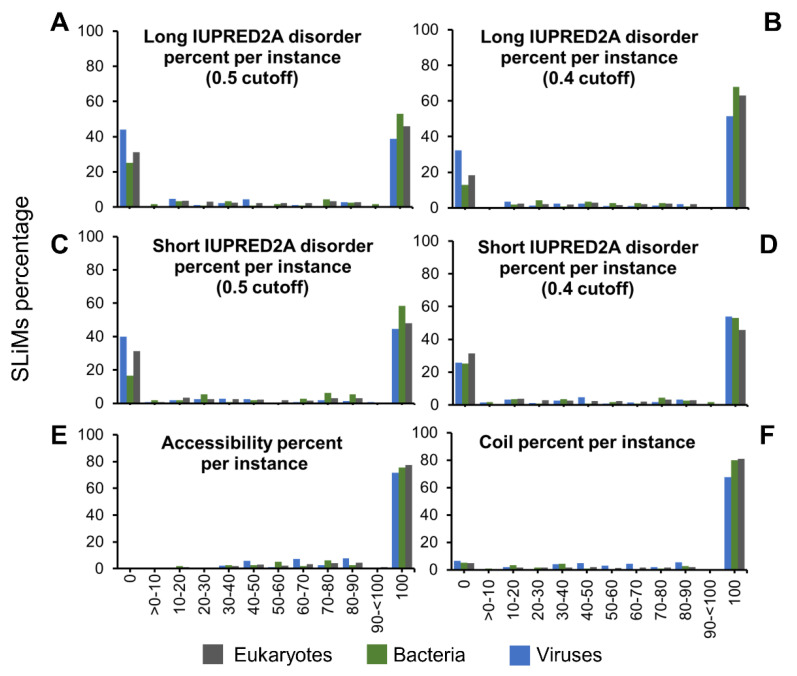
Figure 2.
Predicted properties per instance across taxonomic groups. The predicted percentage per instance; IUPRED2A long disorder based on 0.5 cutoff (A) and 0.4 cutoff (B), IUPRED2A short disorder based on 0.5 cutoff (C) and 0.4 cutoff (D), NetSurfP 2.0 accessibility based on 0.25 cutoff (E), and NetSurfP 2.0 prediction of coil based on three state analysis (F). For further information, see Table S1.

