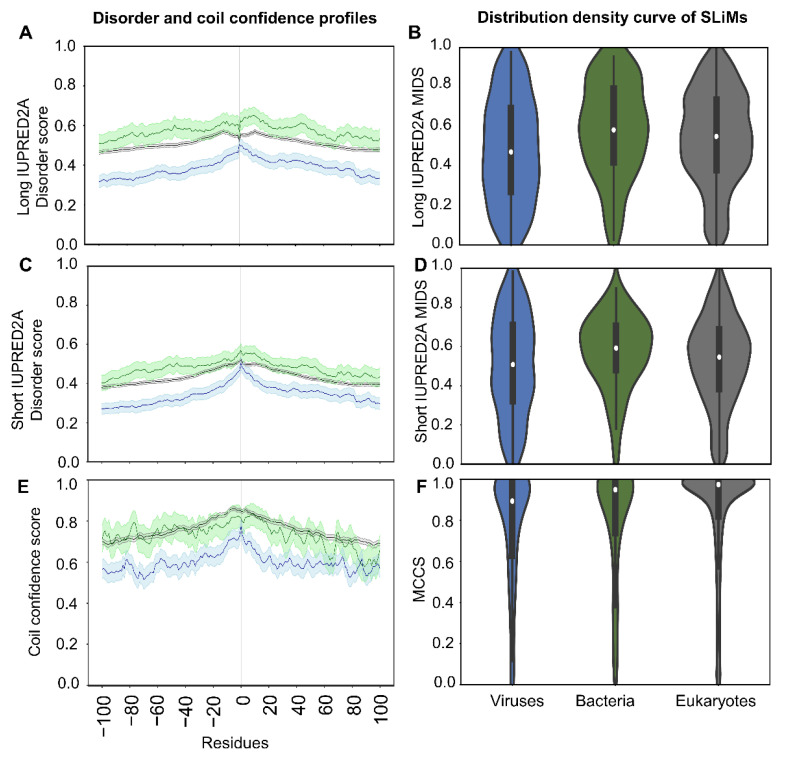
Figure 5.
Disorder and coil confidence profiles of proteins containing SLiMs and the density curve of MIDS and MCCS of SLiMs per taxonomic group. The flanking regions of 100 residues around SLiMs using long IUPRED2A disorder score per taxonomic group and the 95% confidence interval of the mean (A). SLiMs long IUPRED2A MIDS density distribution plot of the SLiMs per taxonomic group (B). The flanking regions of 100 residues around SLiMs using short IUPRED2A disorder score per taxonomic group and the 95% confidence interval of the mean (C). SLiMs short IUPRED2A MIDS density distribution plot of the SLiMs per taxonomic group (D). The flanking regions of 100 residues around SLiMs coil confidence score per taxonomic group and the 95% confidence interval of the mean (E). SLiMs MCCS density distribution plot of the SLiMs per taxonomic group (F). For further information, see Table S3.

