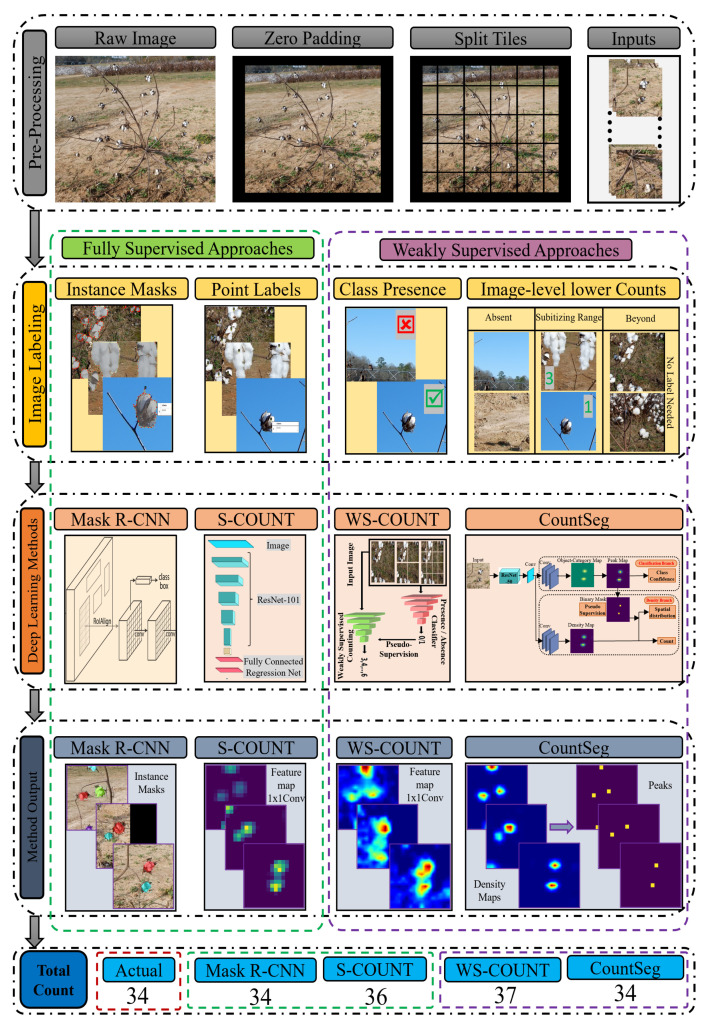
Figure 4.
Overview of the boll counting workflow.The image tiles generated after pre-processing were labelled with point and mask labels. The classification labels () and image-level boll counts (1, 2, 3…) were derived from point label counts. Two fully supervised and two weakly supervised counting methods were trained on the image tiles’ training set (Table 2). The intermediate and final stage output of each methods can be visualized by instance masks and feature maps that will be used to obtain final boll count. In this example, the raw image (top row) contains 34 cotton bolls which were predicted accurately by both the Mask R-CNN and CountSeg Methods.

