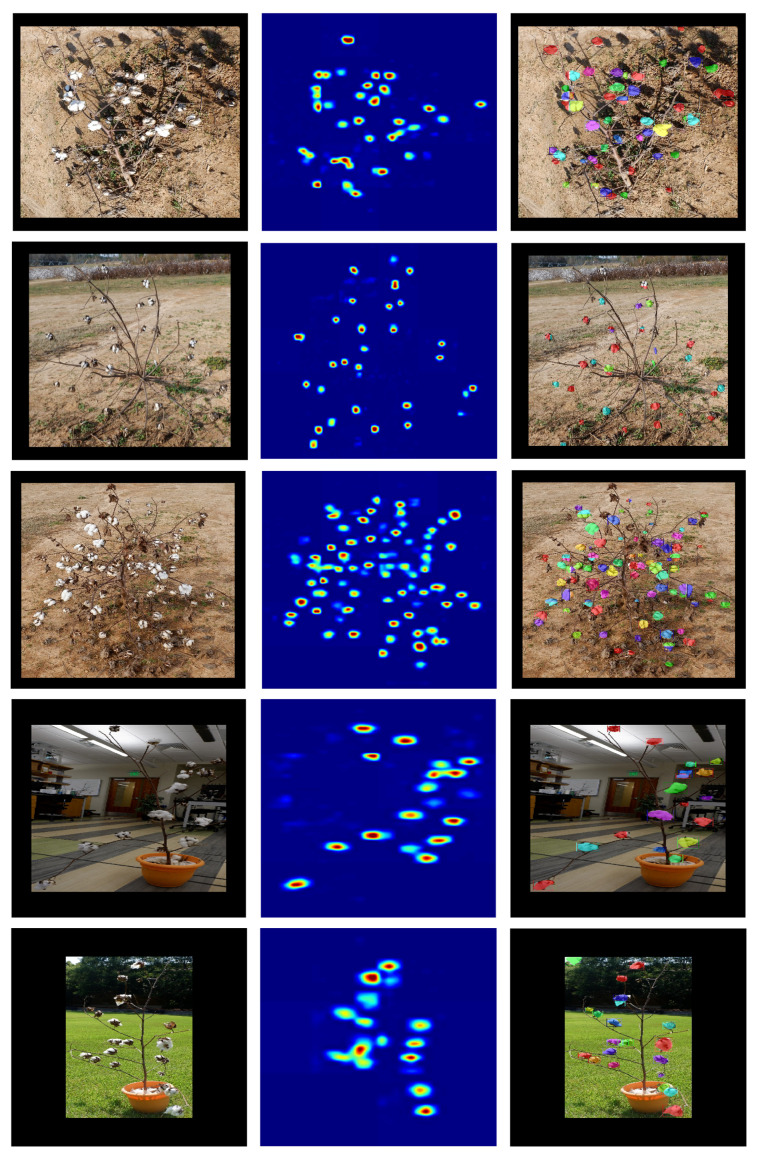
Figure 7.
Comparison of CountSeg and Mask R-CNN. This shows the output from CountSeg density maps and prediction instance masks from Mask R-CNN for 5 held-out test samples (starting from the top row): Boll_008, Boll_022, Boll_041, Boll_116, Boll_127, respectively. It can be observed that even with lower supervision, CountSeg was able to retain the spatial contexts for most of the bolls.

