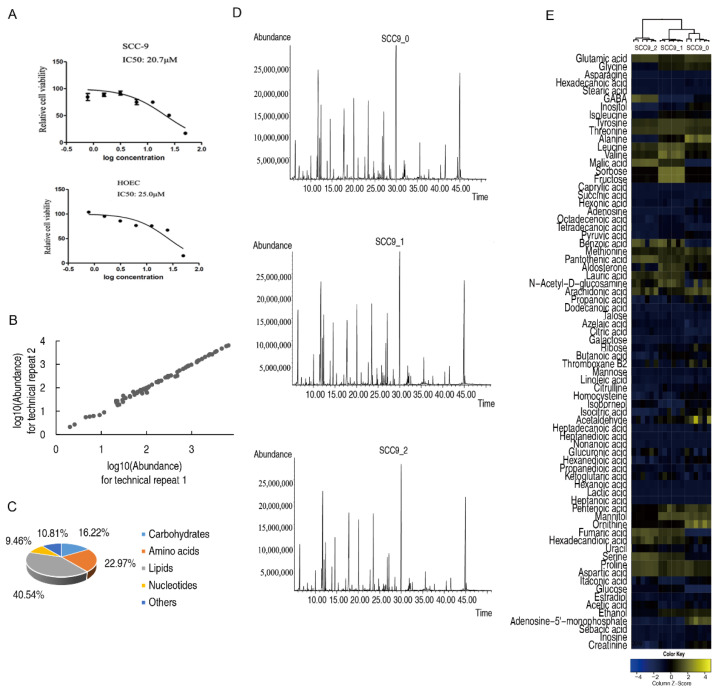
Figure 1.
Metabolomics profiles of SCC-9 cells. Measurements of IC50 of SCC-9 and HOEC cells (A). Reproducibility of the metabolomics profiling platform (B). Classification of metabolites (C). Representative total ion current chromatograms (D). Cluster analysis of all metabolites (E). SCC9_0, SCC9_1 and SCC9_2 represent the SCC-9 cells treated with cisplatin for 0 h, 24 h or 48 h.

