Figure 1.
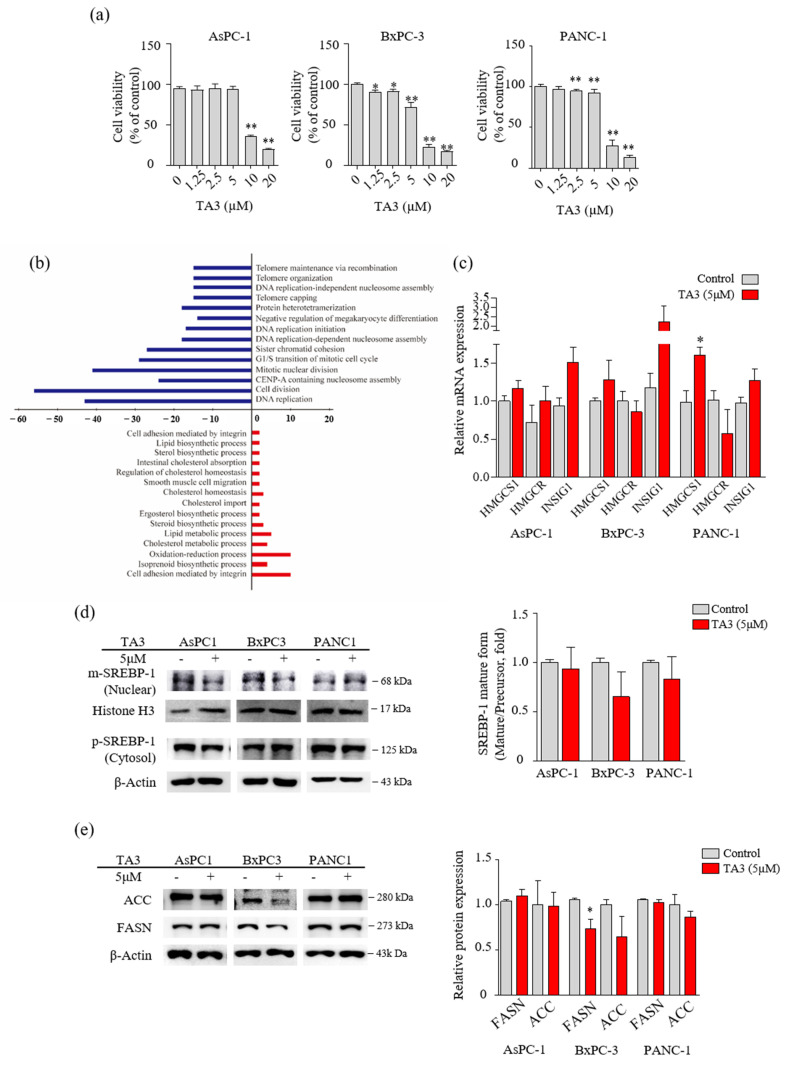
TA3 affected the regulation of enzymes involved in lipid metabolism in BxPC3 cells. (a) The cells were treated with TA3 at various concentrations for 24 h. The cell viability was measured using an MTT assay. (b) Differentially expressed oncologic genes presented a distribution of biologic functions when using 5 μg/mL TA3 on BxPC-3 cells. Up- and downregulated genes were grouped into 15 and 14 biologic functional categories based on the microarray annotation system. The x-axis represents the number of gene transcripts for the 1.5-fold change regulation in each category. Negative values (blue bar) represent downregulated genes and positive values (red bar) represent upregulated genes after the TA3 treatment. (c) RNA expression for the indicated genes was measured using qRT-PCR in the PC cell lines. Same as the microarray, the three cell lines were treated with 5 μM TA3 for 24 h. (d,e) To evaluate the expression of proteins, the three cell lines were incubated with TA3 (5 μM) for 12 h. (d) The extracts separated into nuclear and cytoplasm were prepared and the lysates were used for immunoblotting to measure the expression of precursor and mature SREBP-1 (pSREBP-1 and mSREBP-1). (e) The effects of TA3 on the FASN and ACC expression levels were identified in the total proteins of three cell lines using immunoblotting. All assay results are indicated in the bar graph as fold changes compared with that of the control as the mean ± SD of three independent experiments (* p < 0.05, ** p < 0.01, vs. control).

