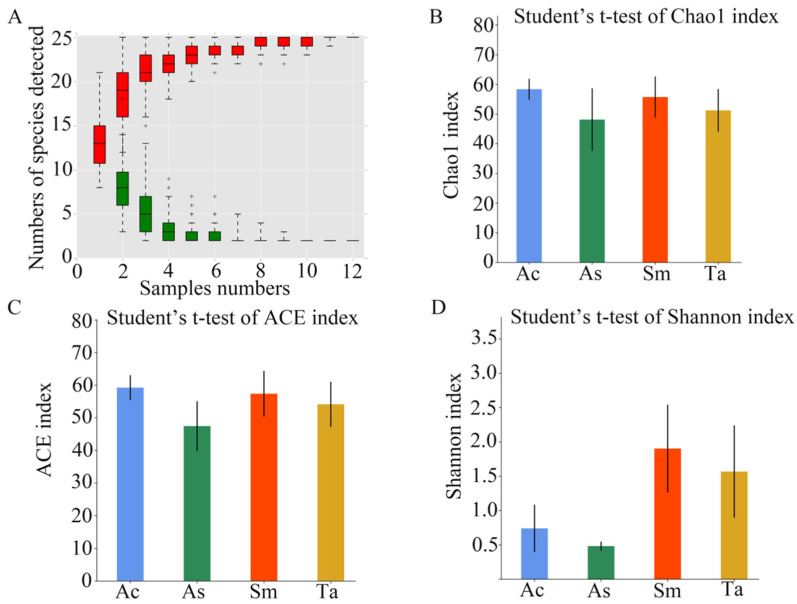
Figure 1.
The results of α-diversity analysis. (A) Species discovery curve. (A single red box in this figure represents the total number of species detected in randomly selected samples. The cumulative curve is composed of the totality of red boxes, which represents the rate of new species appearing under continuous sampling; a single green box in this figure represents the number of common species detected in a given number of samples. The set of green boxes form the common quantity curve, which represents the rate of common species detected under continuous sampling). (B) Chao1 index of the four species of grasshoppers. (C) ACE index of the four species of grasshoppers. (D) Shannon index of the four species of grasshoppers. Ac, Acridia chinensis; As, Atractomorpha sinensis; Sm, Sphingonotus mongolicus; Ta, Trilophidia annulate.

