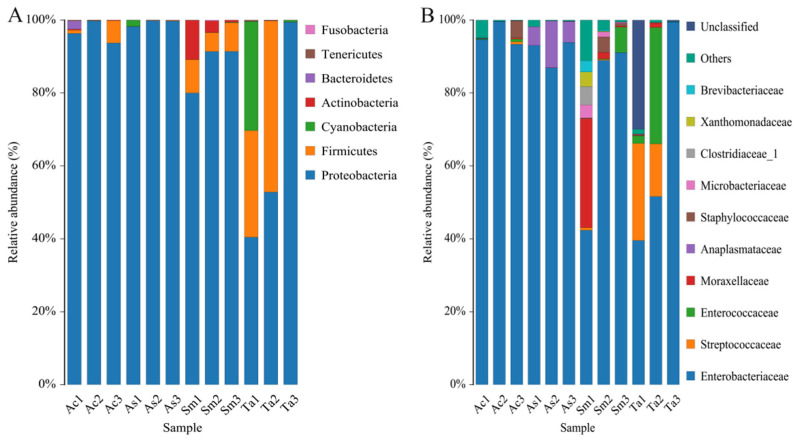
Figure 3.
Bacterial abundance histogram at (A) the phylum level and (B) the family level. Each color represents a species, and the height of the color block indicates the proportion of the species in relative abundance. The top 10 genera in relative abundance were shown in Figure 3B. “Others” represented the remaining. “Unclassified” represented OTUs that were not commented. Ac, Acridia chinensis; As, Atractomorpha sinensis; Sm, Sphingonotus mongolicus; Ta, Trilophidia annulate.

