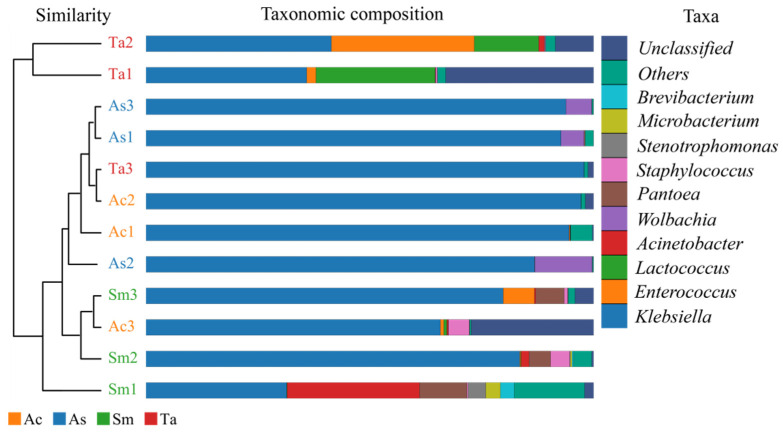
Figure 4.
UPGMA cluster tree combined with histogram. The clustering tree and the abundance histogram are shown on the left and on the right, respectively. The top 10 genera in relative abundance were shown here. “Others” represented the remaining. “Unclassified” represented OTUs that were not commented. Ac, Acridia chinensis; As, Atractomorpha sinensis; Sm, Sphingonotus mongolicus; Ta, Trilophidia annulate.

