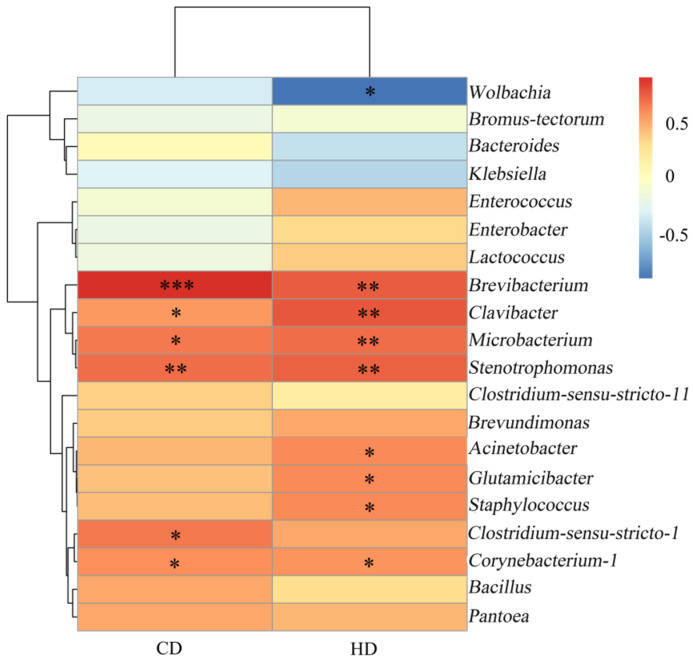
Figure 9.
Heatmap of the correlation between digestibility and bacterial abundance. Dendrograms of hierarchical cluster analysis grouping genera is shown on the left. * There is a significant correlation of 5% between digestibility and bacteria. ** There is a significant correlation of 1% between digestibility and bacteria. *** There is a significant correlation of 0.1% between digestibility and bacteria. CD, cellulose digestibility; HD, hemicellulose digestibility.

