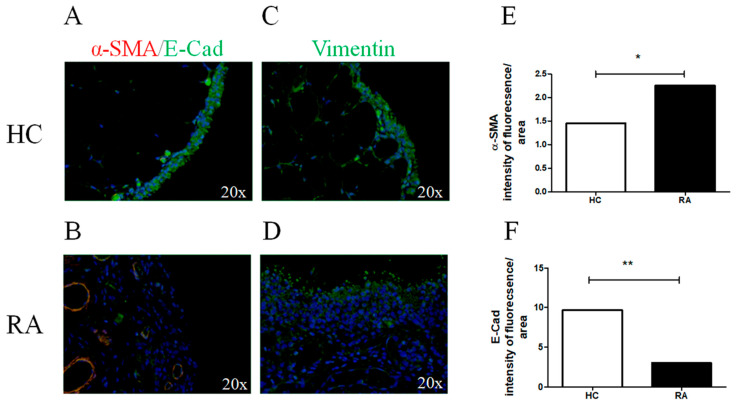
Figure 1.
Myofibroblast markers expression in synovial tissue of patients with RA and HCs. (A,B) α-SMA (red) and E-Cad (green) immunofluorescence (IF) of HC (A) and RA (B) synovial tissue; (C,D) vimentin (green) IF of HC (C) and RA (D) synovial tissue. In RA synovial tissue, the intensity of fluorescence of α-SMA (E) was increased, whereas E-Cad (F) was decreased when compared to HCs. The histogram showed median for each synovial tissue (* = p = 0.01; ** = p = 0.001). Original magnification ×20.

