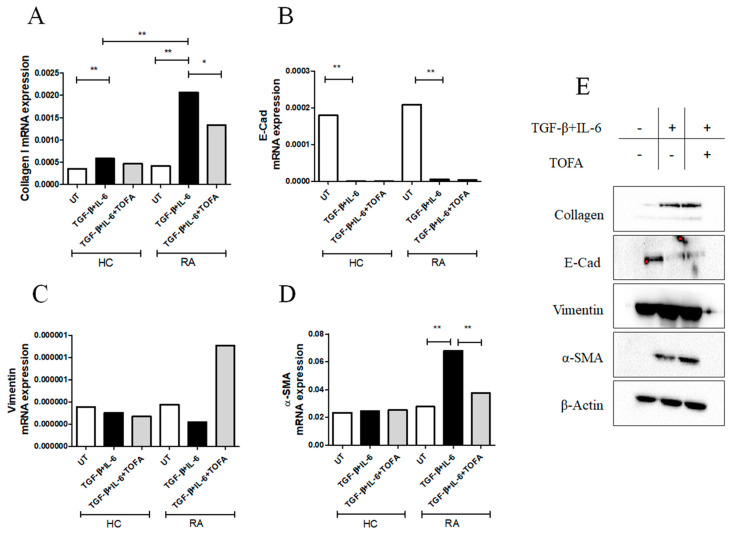
Figure 2.
The effects of TGF-β and IL-6 with or without tofacitinib (TOFA) stimulations on RA-FLSs. (A) qRT-PCR of collagen I (TGF-β + IL-6 stimulation: collagen I mRNA expression in HCFLSs treated with TGF-β + IL-6 0.00058 (0.00047–0.00072) vs. collagen I mRNA expression in untreated (UT)-HC-FLSs 0.00035 (0.00024–0.00041), p = 0.002; collagen I mRNA expression in RA-FLSs treated with TGF-β + IL-6 0.0020 (0.0018–0.0035) vs. collagen I mRNA expression in RA-HC-FLSs 0.00041 (0.00027–0.0013), p = 0.002), (TOFA stimulation: collagen I mRNA expression in RA-FLSs treated with TGF-β + IL-6 0.0020 (0.0018–0.0035) vs. collagen I mRNA expression in RA-FLSs treated with TGF-β + IL-6 and TOFA 0.0013 (0.00029–0.0020), p = 0.01). (B) E-Cad (TGF-β + IL-6 stimulation: E-Cad mRNA expression in HC-FLSs treated with TGF-β and IL-6 8.38 × 10⁻⁷ (4.23 × 10⁻⁷–1.46 × 10⁻⁶) vs. E-Cad mRNA expression in UT-HC-FLSs 0.00017 (7.69 × 10⁻⁵–0.00023), p = 0.002; E-Cad mRNA expression in RA-FLSs treated with TGF-β + IL-6 5.99 × 10⁻⁶ (7.67 × 10⁻⁷–7.70 × 10⁻⁶) vs. E-Cad mRNA expression in UT-RAFLSs 0.00020 (1.28 × 10⁻⁵–0.00030), p = 0.002). (C) Vimentin, no significant results were retrieved following stimulation with TGF-β + IL-6 with or without TOFA. (D) α-SMA (TGF-β + IL-6 stimulation: α-SMA mRNA expression in RA-FLSs treated with TGF-β + IL-6 0.067 (0.048–0.10) vs. α-SMA mRNA expression in UT-RA-FLSs 0.027 (0.01–0.043), p = 0.002); (TOFA stimulation: α-SMA mRNA expression in RA-FLSs treated with TGF-β + IL-6 0.067 (0.048–0.10) vs. α-SMA mRNA expression in RA-FLSs treated with TGF-β + IL-6 and TOFA 0.037 (0.0057–0.055), p = 0.004). The histogram showed median of triplicate experiments (* = p = 0.01; ** = p < 0.004). (E) Western blot analyses of collagen I, E-Cad, vimentin, and α-SMA; pictures are representative of all the experiments. The grouping of gels/blots cropped from different parts of the same gel. No high-contrast (overexposure) of blots was performed.

