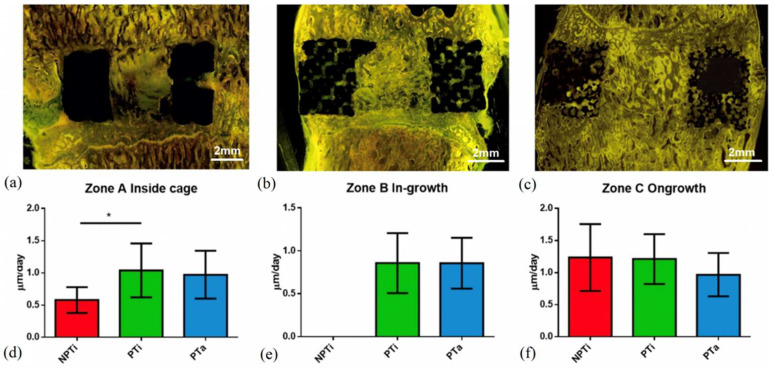
Figure 8.
In vivo bone growth rate evaluated through fluorescence microscopy and labeled with tetracycline. (a) Nonporous titanium cage (NPTi); (b) 60% porous titanium cage (PTi); (c) porous tantalum cage (PTa); (d) A = bone inside cage between two endplates (bone graft), B = inside of cage (bone ingrowth), and C = bone surrounding the implant (bone ongrowth); (e) bone growth in Zone A; (f) bone growth in Zone B. (n = 6), * p < 0.05.

